Collecting Data about people and Comparing the Health of Groups - Ovarian Cancer Flashcards
(28 cards)
Why compare the health of groups?
- Research questions such as:
- Is this disease increasing in …?
- Does it occur with … frequency in my local community?
- Is incidence associated with some suspected … …?
- Has the outcome changed since … measures were instituted?
- Differences between groups at a … in time / Differences between groups … time
- Research questions such as:
- Is this disease increasing in prevalence?
- Does it occur with undue frequency in my local community?
- Is incidence associated with some suspected risk factor?
- Has the outcome changed since control measures were instituted?
- Differences between groups at a point in time / Differences between groups over time
How do we compare the health of groups?
- Cross-sectional study -> one group surveyed to test associations between … and …/s
- Ecological study -> community/population observed to test associations between … and …/s
- Both studies focus on simultaneous observation of … and …, but difference is unit of observation
- Cross-sectional study – focus on … level data
- Ecological study – focus on …-level data
- Cross-sectional study à one group surveyed to test associations between exposures and outcome/s
- Ecological study à community/population observed to test associations between exposures and outcome/s
- Both studies focus on simultaneous observation of exposure and outcome, but difference is unit of observation
- Cross-sectional study – focus on individual level data
- Ecological study – focus on population-level data
How do we compare the health of groups? (2)
- Cohort study -> …-… participants followed up to see if they develop a … (condition/outcome) of interest
- Usually with groups who differ at outset on some …/s of interest
- Case–control study -> groups who differ at outset on … (condition/outcome) …
- Look back at …/s of interest
- Randomised controlled trial (RCT) -> groups who are randomly allocated to receive …/s versus …/s
- Test safety and efficacy/effectiveness of interventions
- Cohort study -> disease-free participants followed up to see if they develop a disease (condition/outcome) of interest
- Usually with groups who differ at outset on some exposure/s of interest
- Case–control study -> groups who differ at outset on disease (condition/outcome) status
- Look back at exposure/s of interest
- Randomised controlled trial (RCT) -> groups who are randomly allocated to receive intervention/s versus comparator/s
- Test safety and efficacy/effectiveness of interventions
Case-control studies
- Case–control study -> groups who … at … on disease (condition/outcome) …
- Two groups of participants are selected – one … (cases) and one … (controls)
- Controls selected to be as … as possible to the cases (e.g. age, gender, occupation, stage of illness, etc.)
- Variables not of interest are matched (i.e. potential …) at selection
- Are Exposures of interest measured or matched at selection?
- Always … -> Past exposure/s in both groups E.g. interview/survey, historical records
- Case–control study -> groups who differ at outset on disease (condition/outcome) status
- Two groups of participants are selected – one with condition (cases) and one without (controls)
- Controls selected to be as similar as possible to the cases (e.g. age, gender, occupation, stage of illness, etc.)
- Variables not of interest are matched (i.e. potential confounders) at selection
- Exposures of interest are not measured or matched at selection
- Always retrospective -> Past exposure/s in both groups E.g. interview/survey, historical records

What are case-control studies?
- groups who differ at outset on disease (condition/outcome) status
- Look back at exposure/s of interest
What type of study?

Case Control Studies
Case-control studies
- We cannot calculate … using case-control data
- Because … = probability of … the outcome of interest
- In case-control studies:
- we have … the outcome
- i.e. we have selected participants into the case group or control group
- we have decided the … of the groups
- Therefore, we cannot calculate … …
- Instead we calculate the odds of cases and controls in terms of their … …
- We calculate an … ratio (OR) which is very similar to the … … (RR)
- We cannot calculate risk using case-control data
- Because risk = probability of developing the outcome of interest
- In case-control studies:
- we have determined the outcome
- i.e. we have selected participants into the case group or control group
- we have decided the size of the groups
- Therefore, we cannot calculate relative risk
- Instead we calculate the odds of cases and controls in terms of their past exposures
- We calculate an odds ratio (OR) which is very similar to the relative risk (RR)
Case-control studies - Example
- Case group - developed ovarian cancer
- Control group - … to case group - no ovarian cancer
- This example study shows that for African-American women, development of ovarian cancer was associated with:
- … odds of 1 year prior to diagnosis, having a BMI of 25 or over
- … odds of having completed post-high school education
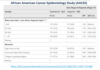
- Case group - developed ovarian cancer
- Control group - similar to case group - no ovarian cancer
- This example study shows that for African-American women, development of ovarian cancer was associated with:
- Greater odds of 1 year prior to diagnosis, having a BMI of 25 or over
- Reduced odds of having completed post-high school education
Strengths of the Case Control Studies
- Can offer some evidence of … – … relationship i.e. association between … and …
- Can identify multiple exposures (both … and … associations)
- Good when disease/outcome is …
- Minimises selection and information …
- R.. - cheaper and typically shorter in duration
- Can offer some evidence of cause – effect relationship i.e. association between exposure and outcome
- Can identify multiple exposures (both positive and negative associations)
- Good when disease/outcome is rare
- Minimises selection and information bias
- Retrospective - cheaper and typically shorter in duration
Weaknesses of the Case Control Studies
- Cannot calculate … or …
- Less suitable for … exposures
- Can be hard to ensure exposure occurred … onset
- Retrospective data availability and quality may be …
- Suitable … group may be difficult to find
- Vulnerable to …
- Cannot calculate prevalence or incidence
- Less suitable for rare exposures
- Can be hard to ensure exposure occurred before onset
- Retrospective data availability and quality may be poor
- Suitable control group may be difficult to find
- Vulnerable to confounding
The Randomised Controlled Trial
- a study in which participants are allocated randomly between an … (e.g. treatment) and a … … (e.g. no treatment or standard treatment)
- a study in which participants are allocated randomly between an intervention (e.g. treatment) and a control group (e.g. no treatment or standard treatment)

Why are RCTs conducted?
-
Safety:
- Ascertain the safe … of a new drug.
- Demonstrate safety and t… of a new …
- Monitor … events profile of a new drug (against an existing drug or placebo)
-
Efficacy/Effectiveness
- Demonstrate efficacy of new drug – does it …?
- Show that treatment T is … or … to treatment X
- Demonstrate effectiveness, and …-effectiveness, of A vs. B
-
Safety:
- Ascertain the safe dose of a new drug.
- Demonstrate safety and tolerability of a new compound
- Monitor adverse events profile of a new drug (against an existing drug or placebo)
-
Efficacy/Effectiveness
- Demonstrate efficacy of new drug – does it work?
- Show that treatment T is superior or equivalent to treatment X
- Demonstrate effectiveness, and cost-effectiveness, of A vs. B
RCTs as an experiment
- RCTs are also a special type of experiment in which randomisation is used
- Randomisation means that potential … variables should be … distributed between groups
- This creates two situations which are identical but:
- One situation in which the supposed cause (intervention of interest) is …
- One situation in which the supposed cause is …
- RCTs can reduce … and allow identification of exposures which are … related to disease of interest
- i.e. identification of interventions which cause reduction in disease likelihood or severity
- RCTs are also a special type of experiment in which randomisation is used
- Randomisation means that potential confounding variables should be equally distributed between groups
- This creates two situations which are identical but:
- One situation in which the supposed cause (intervention of interest) is present
- One situation in which the supposed cause is absent
- RCTs can reduce confounding and allow identification of exposures which are causally related to disease of interest
- i.e. identification of interventions which cause reduction in disease likelihood or severity
Strengths of the RCT
- Establish the s… and e…/ e… of new interventions
- Minimise selection and information …
- Best single-study evidence for … association between exposure (intervention) and outcome
- Establish the safety and efficacy/ effectiveness of new interventions
- Minimise selection and information bias
- Best single-study evidence for causal association between exposure (intervention) and outcome
Weaknesses of the RCT
- …-consuming, difficult and e…
- Not immune to …
- Issues with participant …-…
- Can lack g…
- Time-consuming, difficult and expensive
- Not immune to bias
- Issues with participant drop=out
- Can lack generalisability
What data can we collect?
- Data properties to consider:
- Categorical (D…)
- B.. variables- e.g. Are you a parent: yes/no; diagnosis of endometriosis (yes/no)
- … categories but no order (unordered categorical) – e.g. Sexual orientation; Smoking (never, former, current);
- Several ordered categories (ordinal) – e.g. Socio-economic status; categorised age; responses on Likert scale
- Continuous variables (S…)
- E.g. age; no. of symptoms; score on a questionnaire such as quality of life or satisfaction
- Data properties to consider:
- Categorical (discrete)
- Binary variables- e.g. Are you a parent: yes/no; diagnosis of endometriosis (yes/no)
- Several categories but no order (unordered categorical) – e.g. Sexual orientation; Smoking (never, former, current);
- Several ordered categories (ordinal) – e.g. Socio-economic status; categorised age; responses on Likert scale
- Continuous variables (scale)
- E.g. age; no. of symptoms; score on a questionnaire such as quality of life or satisfaction
Using data to compare health outcomes of groups
- Does one group report higher scores (on a … scale) than another?
- E.g. is condition or intervention X associated with reduced symptoms compared to condition/intervention Y?
- …-test or ANOVA
- Does one group have a higher proportion of an outcome than another (c…)?
- E.g. is condition/intervention X associated with increased frequency of diagnosis P?
- … … test
- Does one group report higher scores (on a continuous scale) than another?
- E.g. is condition or intervention X associated with reduced symptoms compared to condition/intervention Y?
- T-test or ANOVA
- Does one group have a higher proportion of an outcome than another (categories)?
- E.g. is condition/intervention X associated with increased frequency of diagnosis P?
- Chi squared test
Error and Power
- Protection against Type I error = threshold for determining when effects are …
- Significance level for p value is typically accepted at …% (or …) i.e. …% chance of type I error
- Protection against Type II error = power of the study to … when … effects are present
- Statistical power is typically accepted at … – …% (or ..-..) i.e. …% or …% chance of type II error
- The larger the sample, the … the statistical power
- Protection against Type I error = threshold for determining when effects are significant
- Significance level for p value is typically accepted at 5% (or 0.05) i.e. 5% chance of type I error
- Protection against Type II error = power of the study to detect when significant effects are present
- Statistical power is typically accepted at 80 – 90% (or 0.8 – 0.9) i.e. 20% or 10% chance of type II error
- The larger the sample, the larger the statistical power

Two aspects of assessing certainty of estimates - P values and Confidence Intervals
-
P values = p…
- When you compare groups using a statistical test (t test, χ2), the result has a p value.
- The p value is the … that the difference observed (or one more extreme) could have occurred by … if the groups compared were really …
- E.g. P 0.05 = 1/20, P 0.01 = 1/100
- P value = type … … protection
- Larger sample = … p value
-
P values = Probability
- When you compare groups using a statistical test (t test, χ2), the result has a p value.
- The p value is the probability that the difference observed (or one more extreme) could have occurred by chance if the groups compared were really alike.
- E.g. P 0.05 = 1/20, P 0.01 = 1/100
- P value = type I error protection
- Larger sample = smaller p value
Two aspects of assessing certainty of estimates - P values and Confidence Intervals
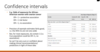
- Confidence Intervals = P…
- The confidence interval describes the range of values with a given … (e.g. 95%) that the true value of a variable is … within that …
- Confidence Intervals = Precision
- The confidence interval describes the range of values with a given probability (e.g. 95%) that the true value of a variable is contained within that range.
T-tests – what’s being tested?
- The (…) hypothesis: There is no difference in quality of life between women who have epithelial ovarian cancer (EOC) versus an ovarian germ cell tumour (OGCT)
- The mean quality of life in the EOC group is the same as the mean quality of life in the OGCT group
- The (…) hypothesis: There is a difference in mean quality of life between the groups (greater in EOC group)
- The between-group difference needs to be … if there is more within-group variability
- e.g. if women vary greatly in quality of life within each group, we would need to see a bigger between-group difference to be sure it is a between-group difference
- Test output: …-statistic and accompanying …-value
- The (null) hypothesis: There is no difference in quality of life between women who have epithelial ovarian cancer (EOC) versus an ovarian germ cell tumour (OGCT)
- The mean quality of life in the EOC group is the same as the mean quality of life in the OGCT group
The (alternative) hypothesis: There is a difference in mean quality of life between the groups (greater in EOC group)
- The between-group difference needs to be greater if there is more within-group variability
- e.g. if women vary greatly in quality of life within each group, we would need to see a bigger between-group difference to be sure it is a between-group difference
- Test output: t-statistic and accompanying p-value
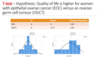
T-test – Hypothesis: Quality of life is higher for women with epithelial ovarian cancer (EOC) versus an ovarian germ cell tumour (OGCT)
- Conclusion?
- (look at P value)

- Conclusion: There is not enough evidence to suggest quality of life is higher for women with epithelial ovarian cancer (EOC) versus an ovarian germ cell tumour (OGCT) (P=0.10) - can’t reject null / accept alternative

Chi-square tests – what’s being tested?
- The (null) hypothesis: There is … … between endometriosis and ovarian cancer.
- The proportion of women with endometriosis who have ovarian cancer is the … as the proportion of women who do not have endometriosis and have ovarian cancer.
- The (alternative) hypothesis: There is … … between endometriosis and ovarian cancer.
- The proportion of women with endometriosis who have ovarian cancer is … … … as the proportion of women who do not have endometriosis and have ovarian cancer.
- Test output: …-… (χ2) statistic and accompanying ….-value
- The (null) hypothesis: There is no association between endometriosis and ovarian cancer.
- The proportion of women with endometriosis who have ovarian cancer is the same as the proportion of women who do not have endometriosis and have ovarian cancer.
- The (alternative) hypothesis: There is an association between endometriosis and ovarian cancer.
- The proportion of women with endometriosis who have ovarian cancer is not the same as the proportion of women who do not have endometriosis and have ovarian cancer.
- Test output: chi-squared (χ2) statistic and accompanying p-value

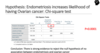
Chi-Square- two groups with categorical outcome - Hypothesis - Endometriosis increases likelihood of having Ovarian cancer
- P value indicates what?
- Reject or accept null hypothesis? (There is no association between endometriosis and ovarian cancer.)

- Strong evidence to reject the null hypothesis of no association between endometriosis and ovarian cancer
- P value is well below the threshold at which is appears that the data we have has not come about by chance