STATS lec 19- clinical stats Flashcards
(19 cards)
1
Q
Risk
A
- In clincal research risk is the probability of something
- P =n/N
- Where P is the risk (probability) n is how often it occurs
- N is the total population under study
- The risk of rolling a 6 is ??
2
Q
Odds
A
- Another way of expressing the likelihood of occurrence
- Odds = n/N-n
- The odds of rolling a 6 are
3
Q
Example- Excelin (high risk)
A
- Disease occurs (event rate) 40% in the control group e.g. 5 yrs death rate
- But only occurs at 30% with drug
- Absolute risk in control group (CER=0.4) = 40% without drug
- Intervention = drug
- Absolute risk in intervention group (IER=0.3) = 30% with drug
4
Q
The cure study
A
- Effects of clopidogrel in addition to aspirin in patients with acute coronary syndromes without ST-segment elevation
- Patients with ACS have major vascular events.. does giving them clopidogrel reduce the risk of these events
- from 11.4% to 9.3% over 12 months
- So CER = 0.114, IER=0.093
5
Q
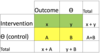
Example 1- 2x2 contingency table

A
- Outcome is always on the top
6
Q
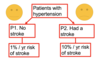
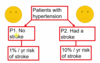
Example 2- Excelin (low risk)
A
- The Excelin trial is repeated in a more healthy population
- Rat eofdeath is 10% in the control group and 7.5% in the intervention group
- CER= 0.1 IER= 0.075
- CER = 10/100
- IER = 7.5/100

7
Q
Absolute risk- AR
A
- AR is how likely something will occur
- The probability that an individual will experience the specified outcome during a specified period
- Range 0 to 1 or %
- In contrast to common usage, the word risk may refer to adverse events or desirable events (MI or CURE)
8
Q
Absolute risk reduction (or increase)
A
- Controlrisk - Interventionrisk
- # 1 (high risk) = 40% - 30% = 1-%
- # 2 (low risk)= 10%-7.5% = 2.5%
- ARR = CER - IER
- Can be misleading since it depends on the population characteristics, tells you more about disease in cohort as oppose to drug
9
Q
Relative risk (risk ratio)- RR
A
- The number of times more likely (RR >1) or less likely (RR<1) an event is to happen in one group compared with another
- It is the ratio of the absolute risk (AR) for each group
- Think of it as the proportional risk
- RR= IER/CER (for both groups RR=0.75)
- RR>1 means increased risk
- RR= 1 means no difference in risk
- RR <1 Means risk reduced
10
Q
Relative risk reduction
A
Controlrisk - Interventionrisk /Controlrisk
- RRR= 40-30/40 = 25% for population 1
- RRR = 10-7.5%/10%= 25% for population 2
- RRR Can be misleading since it doesn’t tell you how many patients will benefit
11
Q
absolute v relative risk
A
- Disadvantage of RRR
- Doesn’t take into account baseline risk of population groups- end up an insignificant result appearing significant
- NB- Large difference between RRR & ARR only occurs when the outcome is rare
- Undue emphase on either RRR or ARR can be misleading- check both before deciding on real benefit of a drug
12
Q
Example 3- superal
A
- Drug superal has RR reduction for stroke of 33% but increased risk of severe gastric bleeding 3-fold
- The baseline risk of gastric bleeding in the general populaiton is 1%/year
- Who should we treat with superal
- What are the RR and AR for stroke in P1 and P2
- What are the RR and AR for adverse effects in P1 and P2
- Calc: CER, IER, ARR, RRR NNT, NNH

13
Q
Superal
A
- Superal has RRR for stroke of 33% but increased risk of severe gastric bleeding- 3 fold
- P1 Primary prevention
- 3%/3yrs, down to 2%… Net effect down by 1%
- Bleed risk is 3%/3yrs increased to 9%/3yrs, net effect up by 6%
- Stroke down by 1%, bleed up by 6%
- P2 Secondary prevention
- 30% risk/3yrs down to 20% net effect down by 10%
- Stroke down by 10 %, bleed up by 6%

14
Q
Numbers needed to treat (NNT)
A
- A more useful way of thinking about effect
- NNT = 1/ARR
- What is the NNT for superal?
- What is the number needed to harm for superal (NNH= 1/ARR)
- NNT is the number of fo subjects who must be treated with the intervention, compared with the control for 1 addiotnal subject to experience the beneficial outcome
15
Q
Superal Numbers needed to
A
- P1-NNT = 100
- P1-NNH = 16
- P2-NNT= 10
- P2-NNH= 16
- Describe in whole numbers
- If necessary round NNT up; Round NNH down
16
Q
Odds ration- OR

A
- Is the ratio of
- Odds of outcome in intervention group … against …
- Odds of outcome in the control group
- Used in cross-sectional studies and case-control studies
- In a (non-real) study of 2,500 patients taking aspirin it was found that 42 had GI bleeding
- The number of people with GI bleeds in the general population is 1 in 100
- What are the odds ration for aspirin causing GI bleeds

17
Q
Odds ratios
A
- RRR, NNT preferred as more intuitive
- Still needed for
- Meta-analyses (As event rates differ between populations)
- Case-control studies- especially where population event rate unknown
- Multiple regression
18
Q
Confidence Intervals- CI
A
- Accuracy of measurement
- CI decreases as sample size increases
- All measures (ARR, RRR, OR) should have confidence intervals
- If the confidence interval for an OR crosses 1, then a significant efect has not been found
19
Q
Ways to cheat on statistical tests
A
- Throw all data in the computer and report all results p<0.05 (data dredging)
- If the two groups are different and this benefits the intervention group, forget to adjust
- Ignore all drop-outs, only analyse subjects that complete treatment
- If outliers (unusal results) are messing up the results then get rid of them. On the other hand, if they make the results better then keep them
- If you gain significance early; stop the trial. If you almost gain significance, the extend the trial
- If the whole group isn’t significant, look for sub-groups that are
