STATS 15- correlation and regression Flashcards
(33 cards)
1
Q
Correlation research design
A
- Experiments may be impractical/Unethical for some research questions
- “Does cholesterol affect the probability of heart disease”
- “Does smoking shorten peoples life expectancy”
- But we can look for relationships between such variables
2
Q
Relationship between 2 variables
A
- Is there a relationship between IQ and Exam marks
- Bivariate data- each participant there are 2 different variables measure, we see for any relationships (C.f. within-subject design)

3
Q
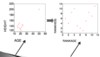
Start with a scatter plot
A
- Height and intelligence
- Data suggests no relationship between height & intelligence
4
Q
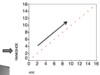
Strong positive Correlation, R=1
A
- strong positive correlation
5
Q
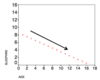
Strong NEGATIVE correlation, R= -1
A
6
Q
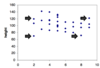
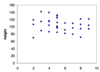
No correlation- Height and intelligence
A
7
Q
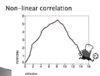
Non-linear correlation
A
- NB: correlations are not about how steep any slope is but about the variation of values around the slope (how well values fit the slope)
- 1= perfect fit
- Strong positive 0-8
- Strong negative 8-14
8
Q
Correlations: Hypotheses testing
A
- Null hypothesis
- No relationship between variables X and Y above that expected by chance alone
- NB: Correlations are not about how steep any slope is, but about the variation of values around the slope
9
Q
Measuring the degree of relationship
A
- Pearson product moment (r)- how well does a straight line fit the data
- r = -1 (perfect negative relationship)-X decreases as Y increases
- r = +1 (perfect positive relationship)-X increases as Y increases
- r = 0 (No linear relationship)
- Is affected by outliers and by number of pairs of data
10
Q
Pearsons
A
- Assumption
- linear relationship between X and Y
- Continuous random variables
- Both variables must be normally distributed
- X and Y must be independent of each other
11
Q
Measuring the degree of the relationship
A
- Pearson, r=
- or - sign indicates = direction of relation
- Value indicates strength. Valye closer to either -1 or +1 reflect a strong correlation valyes close too 0 mean weak/no correlation
- r= -0.65 quite strong negative correlation
- r= +0.65 equally strong positive correlation
- P value indicates significance
12
Q
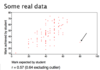
Some real data
A
- Positive but not very strong relationship
- With quite a lot of variability
13
Q
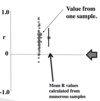
And if we collect more data
A
*

14
Q
The null hypothesis (r=0)
A
- What is the chance that there really isn’t a correlation (r=0)
- OR
- That we got our value of r by chance p<0.05
15
Q
What it all means
A
- r= +0.701 ; p<0.001 (N=30)
- 0.701 => How close are the points to a straight line
- p<0.001 =>How likely is it that the true correlation co-efficient is actually zero (no correlation) and we got this r value by chance
- N=30 => how may pairs of points there are
16
Q
Interpret correlations cautiously
A
- Correlation does NOT imply causality
- Correlations are affected by range restrictions
- E.g. Height… you don’t get many people above 7ft
- Correlations are affected by outliers
- Correlation only measures the degree of LINEAR relationships
- Plot the graph to see if linear
17
Q
Correlation and causation
A
- Ice cream sales and the number of shark attacks on swimmers are correlated
- The number of cavities in primary school children and vocabulary size has a strong positive correlation
- Cant say vocab causes cavities (Probably due to age)
- The more tvs per citizen the longer the average life expectancy of a country
- Patients operated on by surgeons with cleaner hands live longer
18
Q
Non-parametric alternatives
A
- Spearman’s Rho
- Spearmans rank correlation co-efficient
- Kendall’s tau
- Cross tabulation, c.f. Chi squared
- Fewer assumptions, robust to outliers, but also less sensitive
19
Q
Advantages of Non-parametric correlation. ranking 1
A
- Can convert non-linear data to linear- allow us to perform linear statistical test on the data
20
Q
Advantages II
A
- Less sensitive to outliers
- ranking can distribute the data more evenly
21
Q
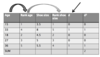
Spearman’s Rho (p, rs)
A
- Tests for a relationship between the ranks of 2 variables
- So put paired variables in tables and rank each one
- Compare differences in ranks
- E.g. Is there a relationship between age and shoe size
22
Q
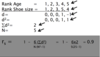
Spearman’s Rho- Formula
A
- d= Difference in rank
- N = Number of participants
- E = sum of

23
Q
Example- Positive correlation
A
24
Q
Reporting the result
A
- The Spearman’s Rho test was applied to the data and a significant positive correlation was found between age and shoe size
- (rs= 0.9, n=5, p<0.05)
- As shoe size increased, age increased
- No implication of causality
25
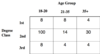
Another rank correlation: Suitable for contingency table data
* contingency table is when you relate on variable to another
* e.g. age of students v classification of degree they got
26
Why not use chi-squared
* Because three cells have less than 5
* See nonparametric testing lectures
* Can use Kendall's Tau
* A method for measuring the association between variables in cross tabulations
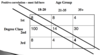
27
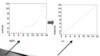
How does Tau work
* If there was a positive correlation between age and classificaiton
* younger = 1st / oldest= 3rd
* we would expect most of the data to fall between the tram lines if it was positively correlated
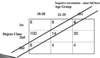
28
How does it work
* we would expect most of the data to fall between the tram lines if it was negatively correlated
* This doesn't happen
* If there was a positive correlation between age and classificaiton
younger = 1st / oldest= 3rd
29
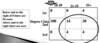
How does it work
* Essentially, Kendall's Tau is a statistic which for each cell compares the number of cases below and to the right of the cell with those above and to the right
*
30
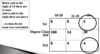
How does it work
* There is not a similar balance in the data meaning it is not correlated
31
Reporting the result
* Tau tells us both the **size** and **direction** (like Spearman's Rho) of the correlation
* Computers can also compute the significance value for the sample size used
* E.g. A Kendall Tau test for ordered contingency tables suggested no significant relationship between age and degree class (tau =-0.44, N=180, p\>0.05
32
Reporting correlations
* Describe data (Including scatterplot)
* Describe relationship in words
* Quote N- if we have a large N we are more likely to see real correlation (or lack of)
* Quote co-efficient (with value of p)- links with how significant our results are
33
Summary of correlations
* Pearsons product moment: r
* Spearman's Rho: rs- suitable for non-parametric data
* Kendall's Tau: T- data represented in a contingency table
* When to use each
* What research design
* Normal data
