STATS 17- Non-parametric 2 Flashcards
(16 cards)
1
Q
Testing difference- Non-parametric tests
A
- Mann Whitney U
- Kruskall-Wallis
- Friedman’s
2
Q
Mann-Whitney U Test
A
- Subjects Design: Independent groups/ Independent measures design
-
Description of tests
- RANKS data
- Counts the number of time one condition is ranked higher than the other
- Calculated statistics (U) is the sum of the number of times values in the first group are higher than values in the second group
3
Q
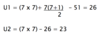
Calculation of “U”
A
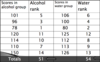
- Rank all of the scores together (as if from one group)
- Add up ranks from the smallest group (or either if both groups are the same size) =R
- N1= Number of cases in smallest group
- N2= Number of cases in the largest group

4
Q
Example
Hypothesis: drinking alcohol the night before an IQ test will affect people’s scores
A
5
Q
Example continued
A
- Use the smaller value of U and compare to the critical values
- U should be equal to or lower than the critical value for significance
6
Q
Critical values of U
A
7
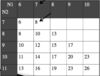
Q
Ranks
A
8
Q
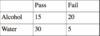
Dichotomous data
A
-
Can’t use Man U for this
- Need to use a chi-square instead- set out as how many people in each condition passed vs. failed (or whatever you are measuring)
- E.G. If passed or failed an exam
- Two conditions: alcohol or water
- Numbers represent the number of people
9
Q
Revision
A
- 1 way= is data different from what we expect from random variation
- 2 way = main effect caused by each variable and wheather there is an interaction between the 2 variables
*
10
Q
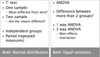
ANOVA assumption
A
- Data normally distributed
- Homogeneity of variance
- If assumptions NOT fulfilled use non-parametric equivalent to ANOVA
- Repeated measures design
- Freidmans (q statistic calculated)
- Independent measures
- Kruskal Wallis (K statistics)
11
Q
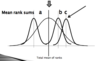
Kruskal-Wallis
A
- Subject design: Independent groups
- Description: Works by ranking scores across groups
- Expect each group to have a similar mean rank if no difference between them
- Uses squared deviations of mean rank sums from the total mean of ranks (weighted by sample size)
- NB: Can only tell you that at least 2 groups are significantly different- not which 2
12
Q
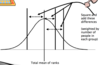
The logic
A
- The test works by calculating the squared deviations of the mean rank sums from the total mean of ranks (weighted by sample size)
- The bigger this summed deviation, the more likely the conditions are significantly different
- The summed value is converted to “H” for convenience
- H follows the chi-square distribution- and like chi-square, the bigger the less likely results are due to chance/sampling error
13
Q
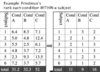
Friedman’s
A
- Subjects design: repeated measures
- Within-subjects
- Description: Changes each individual’s set of scores in the ‘x’ conditions to a rank; so if there are 3 conditions each subject will have rank 1,2,3
- Each subject does each condition, rank the highest score for each condition
- If the null hypothesis is true, the order of the ranks will vary randomly and the sum of ranks for each condition will be approximately the same
14
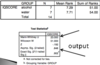
Q
Example (Continued)
A
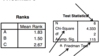
- A measure of dispersion of the rank sums is obtained by summing the squared deviations of the rank sums from the mean rank sum= S
- “S” can then be converted easily to X2r (Is distributed like chi-squared) to assess significance
15
Q
Friedman’s
A
16
Q
Can you?
A
- Identify the type of data you are collecting
- Identify the research design you are using
- Choose the correct descriptive statistics to summarise that data
- Select the appropriate test to analyse your data
- INTERPRET the result in the context of the experiment
