STATS- Lec 12 T tests Flashcards
(24 cards)
1
Q
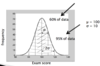
Normal distribution
A
- You can only use t tests that are normally distributed
- (68% = 1 SD, 95% = 2SD)
*
2
Q
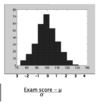
Quick reminder
A
- Normal distribution
- 60% with 1 SD
- 95% within 2 SD
- Z scores
- -1 to 1: 60%
- -2 to 2: 95%
- Need to know
- True mean
- SD
3
Q
Guinness
A
- ‘Student’ alias Willian Gosset (1908) was an employee of Guinness breweries
- He was looking for a metric of quality control
4
Q
“Student” realised that
A
- What if true mean and SD are unknown
- Have to estimate mean (and variability) from a limited number of measurements
- Cannot calculate z scores
- Creates a “t distribution”
- NUMBER of measurements important
- A large number of estimates (>30) then t distribution is just like z distribution
- Number of measurements related to “Degrees of freedom” of an experiment
5
Q
Degree of freedom
A
- This is the difference between the number of measurements made the number of parameters estimated
- A parameter is a value that describes something
- For example
- Estimating the mean (1 parameter) from 5 numbers leaves 4 degrees of freedom in an estimate, the more reliable the estimate
6
Q
T and degree of freedom
A
- Unlike z, the t distribution depends on the number of degrees of freedom
- Hence t relies on the number of measurements made the number of parameters
- The more degrees of freedom, the closer t comes to z
- If t and z were exactly the same then 95% of data would fall between t = -2 and +2: This only happens when the number of degrees of freedom is 30 or more
- If they are smaller than 30 df than the critical value (t value between which 95% is held) will be greater than 2
- The concept of a CRITICAL VALUES: tcrit
7
Q
Is that t-value significant
A
- Depends on the Df
- [t] >3.18 Df=3, p<0.05; 5% probability it is not significant
- [t] >2.45 Df=6, p<0.05
- [t] >1.98 Df=30, p<0.05 (same as z)
- The fewer measurements, the larger the t values have to be to reach significance
- small t value unlikely to be significantly different from chance
8
Q
How to calculate a t values
A
- Independent measures
- For independent samples
- Between subjects design
- t=difference in means/ difference expected by chance
- t= Mean 1- Mean 2 / SD of the means
- Data HAS to be normally distributed
9
Q
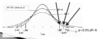
The 2 sample t-test visualized
A
*
10
Q
For repeated measures design
A
- WITHIN subjects design
- 2 measurements made in EACH subject
- e.g. Before treatment and after
- Calculate CHANGE in EACH SUBJECT
- t= Mean change / Change expected by chance
- Measure the height of a person, measure the height of the same person with socks on
11
Q
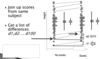
The repeated measures t-tests
A
- Join up scores from the same subject
- Get a list of difference d1,d2…d100
12
Q
Reporting results
A
- The statistic value (t=1.95)
- Degrees of freedom (df=39)
- Significance level (p<0.025)
- There was a significant difference between the 2 groups (t=1.95, df=39, p<0.025)
- NB. Interpretation of the meaning of that difference depends on the research design
13
Q
Standard error and repeated measures t-test- Visualising data
A
14
Q
The sample mean
A
- In practice, you can’t survey everyone in a population
- You take a sample of that population and assume that it is representative
- The sample mean is an estimate of the true population mean
15
Q
But how accurate is your sample mean
A
- If you were to estimate the mean over and over again what would be the spread
- The standard error (known as the standard error of the mean)
- The standard error depends on two things: the standard deviation of the original distribution and the number of samples
16
Q
Standard error
A
- How well do you know the mean value
- Depends on how many samples you have
- the standard error is a measure of how close the sample mean is to the true mean
- If you make a number of estimates of the sample mean, 95% of them will be within plus or minus 2 standard errors of the true mean
- Can you think why this is
- As sample size increases the standard error decreases- accuracy increases

17
Q
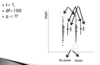
The 2 sample t-test visualized

A
- T = difference between means / Pooled standard error
- A = no sigficicant difference

18
Q
The repeated measures t-test
A
- Re-test the same group of subject
- More sensitive than independent sample tests
- Need fewer subjects
- BUT sensitive to carry-over/ Order effects
19
Q
The repeated measures t-test

A
- Join up scores from the same subject
- Get a list of differences

20
Q
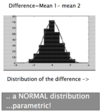
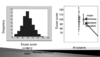
Distribution of differences
A
- Null hypothesis: the mean difference will be zero
- The standard error of the mean difference is much smaller than the standard errors of the mean
21
Q
What should you know
A
- The standard error is an estimate of how reliable a mean value is
- Large number of samples, small standard error
- Repeated measures tests work because they look at the distribution of the differences (which are much less variable)
22
Q
What do z and t tell you
A
- z tells you how different an individual was from the group
- t tells you how different the means of 2 groups are:
23
Q
What is the standard error
A
- The standard error is the variability of group means you’d expect by chance
- The more ‘standard errors’ apart 2 mean values are, the bigger the t value, the smaller the p-value
- Big t = little p = BIGGER significant difference
- Likewise, could define standard deviation as the variability across individuals you’d expect by chance
24
Q
Another look at the t-test
A
- Variability due to error (poor sampling, poor method)
- Difference due to factor
- t= Difference due to factor/variability due to error

