Public Health Sciences - First Aid Flashcards
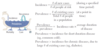
Observational Studies:
- frequency of disease and frequency of risk-related factors are assessed in the present
- “What is happening?”
- disease prevalence
- can show risk factor association with disease, but does not establish causality
Cross-Sectional Study
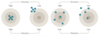
Observational Studies:
- compares a group of people with disease to a group without disease.
- looks to see if odds of prior exposure or risk factor differs by disease state
- “What happened?”
- Odds Ratio (OR)
Case-Control Study
Observational Studies:
- compares a group with a given exposure or risk factor to a group without such exposure
- looks to see if exposure or risk factor is associated with later development of disease
- Prospective—“Who will develop disease?”
- Retrospective—“Who developed the disease [exposed vs. nonexposed]?”
- Relative Risk (RR)
Cohort Study
Observational Studies:
- compares the frequency with which both monozygotic twins vs. both dizygotic twins develop the same disease
- measures heritability and influence of environmental factors (“nature vs. nurture”)
Twin Concordance Study
Observational Studies:
- compares siblings raised by biological vs. adoptive parents
- measures heritability and influence of environmental factors
Adoption Study
A _____ is an experimental study involving humans. Compares therapeutic benefits of 2 or more treatments, or of treatment and placebo.
Clinical Trial
Study quality improves when the study is randomized, controlled, and _____ (ie. neither patient nor doctor knows whether the patient is in the treatment or control group).
Double-Blinded
_____ refers to the additional blinding of the researchers analyzing the data.
Triple-Blind
Four Phases of Clinical Trials
“Does the drug SWIM?
- Is it Safe?
- Does it Work?
- Any Improvement?
- Can it stay in the Market?
Phases of Clinical Trials:
- small number of healthy volunteers or patients with disease of interest
- “Is it safe?”
- assesses safety, toxicity, pharmacokinetics, and pharmacodynamics
Phase I
Phases of Clinical Trials:
- moderate number of patients with disease of interest
- “Does it work?”
- assesses treatment efficacy, optimal dosing, and adverse effects
Phase II
Phases of Clinical Trials:
- large number of patients randomly assigned either to the treatment under investigation or to the best available treatment (or placebo)
- “Is it as good or better?”
- compares the new treatment to the current standard of care
Phase III
Phases of Clinical Trials:
- postmarketing surveillance of patients after treatment is approved
- “Can it stay?”
- detects rare or long-term adverse effects
- can result in treatment being withdrawn from market
Phase IV
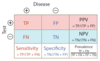
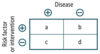
Evaluation of Diagnostic Tests
- Uses 2 × 2 table comparing test results with the actual presence of disease.
- Sensitivity and specificity are fixed properties of a test. PPV and NPV vary depending on disease prevalence in population being tested.

Evaluation of Diagnostic Tests:
- proportion of all people with disease who test positive, or the probability that when the disease is present, the test is positive
- value approaching 100% is desirable for ruling out disease and indicates a low false-negative rate
- used for screening in diseases with low prevalence
Sensitivity (True-Positive Rate)
- Sn = TP / (TP + FN)
- Sn = 1 – FN rate
- SN-N-OUT = highly SeNsitive test, when Negative, rules OUT disease
- if sensitivity is 100%, then FN is zero
- all negatives must be TNs

Evaluation of Diagnostic Tests:
- proportion of all people without disease who test negative, or the probability that when the disease is absent, the test is negative
- value approaching 100% is desirable for ruling in disease and indicates a low false-positive rate
- used for confirmation after a positive screening test
Specificity (True-Negative Rate)
- Sp = TN / (TN + FP)
- Sp = 1 – FP rate
- SP-P-IN = highly SPecific test, when Positive, rules IN disease
- if specificity is 100%, then FP is zero
- all positives must be TPs

Evaluation of Diagnostic Tests:
probability that a person who has a positive test result actually has the disease
Positive Predictive Value
- PPV = TP / (TP + FP)
- PPV varies directly with pretest probability (baseline risk, such as prevalence of disease)
- high pretest probability → high PPV

Evaluation of Diagnostic Tests:
probability that a person with a negative test result actually does not have the disease
Negative Predictive Value
- NPV = TN / (TN + FN)
- NPV varies inversely with prevalence or pretest probability
Possible Cutoff Values
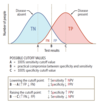
_____ is the likelihood that a given test result would be expected in a patient with the target disorder compared to the likelihood that the same result would be expected in a patient without the target disorder.
Likelihood Ratio
- LR+ > 10 and/or LR– < 0.1 indicate a very useful diagnostic test
- LRs can be multiplied with pretest odds of disease to estimate posttest odds
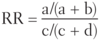
Quantifying Risk
Definitions and formulas are based on the classic 2 × 2 or contingency table.

Quantifying Risk:
- typically used in case-control studies
- depicts the odds of a certain exposure given an event (eg. disease; a/c) vs. the odds of exposure in the absence of that event (eg. no disease; b/d)

Odds Ratio
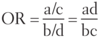
Quantifying Risk:
- typically used in cohort studies
- risk of developing disease in the exposed group divided by risk in the unexposed group (eg. if 5/10 people exposed to radiation get cancer, and 1/10 people not exposed to radiation get cancer, the _____ is 5, indicating a 5 times greater risk of cancer in the exposed than unexposed)
- for rare diseases (low prevalence), OR approximates _____.
Relative Risk
- RR = 1 → no association between exposure and disease
- RR > 1 → exposure associated with ↑ disease occurrence
- RR < 1 → exposure associated with ↓ disease occurrence
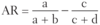
Quantifying Risk:
the difference in risk between exposed and unexposed groups (eg. if risk of lung cancer in smokers is 21% and risk in nonsmokers is 1%, then the attributable risk is 20%)

Attributable Risk
Quantifying Risk:
the proportion of risk reduction attributable to the intervention as compared to a control (eg. if 2% of patients who receive a flu shot develop the flu, while 8% of unvaccinated patients develop the flu, then RR = 2/8 = 0.25, and _____ = 0.75)
Relative Risk Reduction
- RRR = 1 − RR
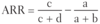
Quantifying Risk:
the difference in risk (not the proportion) attributable to the intervention as compared to a control (eg. if 8% of people who receive a placebo vaccine develop the flu vs. 2% of people who receive a flu vaccine, then
_____ = 8% − 2% = 6% = .06).

Absolute Risk Reduction
Quantifying Risk:
- number of patients who need to be treated for 1 patient to benefit
- lower number = better treatment
Number Needed to Treat
- NNT = 1/ARR
Quantifying Risk:
- number of patients who need to be exposed to a risk factor for 1 patient to be harmed
- higher number = safer exposure
Number Needed to Harm
- NNH = 1/AR
Incidence vs. Prevalence
- Incidence looks at new cases (incidents)
- Prevalence looks at all current cases
- prevalence ∼ pretest probability
- ↑ prevalence → ↑ PPV and ↓ NPV
_____ is the consistency and reproducibility of a test. It is the absence of random variation in a test.
Precision (Reliability)
- random error ↓ precision in a test
- ↑ precision → ↓ standard deviation
- ↑ precision → ↑ statistical power (1 − β)
_____ is the trueness of test measurements. It is the absence of systematic error or bias in a test.
Accuracy (Validity)
- systematic error ↓ accuracy in a test

Bias and Study Errors:
Recruiting Participants
Selection Bias
Bias and Study Errors:
- nonrandom sampling or treatment allocation of subjects such that study population is not representative of target population
- most commonly a sampling bias
Selection Bias
Bias and Study Errors:
- selection bias
- study population selected from hospital is less healthy than general population
Berkson Bias
Bias and Study Errors:
- selection bias
- participating subjects differ from non-respondents in meaningful ways
Non-Response Bias
Bias and Study Errors:
Selection Bias can be reduced by _____.
- randomization
- choice of the right comparison/reference group
Bias and Study Errors:
Performing Study
- Recall Bias
- Measurement Bias
- Procedure Bias
- Observer-Expectancy Bias
Bias and Study Errors:
- awareness of disorder alters recall by subjects
- common in retrospective studies
- patients with disease recall exposure after learning of similar cases
Recall Bias
Bias and Study Errors:
Recall Bias can be reduced by _____.
decreasing the time from exposure to follow-up
Bias and Study Errors:
- information is gathered in a systemically distorted manner
- association between HTN and MI not observed when using faulty automatic sphygmomanometer
Measurement Bias
Bias and Study Errors:
- measurement bias
- participants change behavior upon awareness of being observed
Hawthorne Effect
Bias and Study Errors:
Measurement Bias can be reduced by _____.
- using objective, standardized, and previously tested methods of data collection that are planned ahead of time
- using a placebo group
Bias and Study Errors:
- subjects in different groups are not treated the same
- patients in treatment group spend more time in highly specialized hospital units
Procedure Bias
Bias and Study Errors:
Procedure Bias can be reduced by _____.
blinding and using of placebo to reduce influence of participants and researchers on procedures and interpretation of outcomes as neither are aware of group allocation
Bias and Study Errors:
- researcher’s belief in the efficacy of a treatment changes the outcome of that treatment (aka. Pygmalion effect)
- an observer expecting treatment group to show signs of recovery is more likely to document positive outcomes
Observer-Expectancy Bias
Bias and Study Errors:
Observer-Expectancy Bias can be reduced by _____.
blinding and using of placebo to reduce influence of participants and researchers on procedures and interpretation of outcomes as neither are aware of group allocation
Bias and Study Errors:
Interpreting Results
- Confounding Bias
- Lead-Time Bias
- Length-Time Bias
Bias and Study Errors:
- when a factor is related to both the exposure and outcome, but not on the causal pathway, it distorts or confuses effect of exposure on outcome
- contrast with effect modification
- pulmonary disease is more common in coal workers than the general population; however, people who work in coal mines also smoke more frequently than the general population
Confounding Bias
Bias and Study Errors:
Confounding Bias can be reduced by _____.
- repeating studies
- using crossover studies (subjects act as their own controls)
- matching (patients with similar characteristics in both treatment and control groups)
Bias and Study Errors:
- early detection is confused with ↑ survival
- early detection makes it seem like survival has increased, but the disease’s natural history has not changed
Lead-Time Bias
Bias and Study Errors:
Lead-Time Bias can be reduced by _____.
measuring “back-end” survival (adjust survival according to the severity of disease at the time of diagnosis)
Bias and Study Errors:
- screening test detects diseases with long latency period, while those with shorter latency period become symptomatic earlier
- a slowly progressive cancer is more likely detected by a screening test than a rapidly progressive cancer
Length-Time Bias
Bias and Study Errors:
Length-Time Bias can be reduced by _____.
a randomized controlled trial assigning subjects to the screening program or to no screening
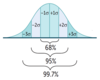
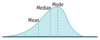
Statistical Distribution:
Measures of Central Tendency
- Mean
- Median
- Mode
Measures of Central Tendency:
- (sum of values)/(total number of values)
- most affected by outliers (extreme values)
Mean
Measures of Central Tendency:
- middle value of a list of data sorted from least to greatest
- if there is an even number of values, it will be the average of the middle two values
Median
Measures of Central Tendency:
- most common value
- least affected by outliers
Mode
Statistical Distribution:
Measures of Dispersion
- Standard Deviation
- Standard Error
Measures of Dispersion:
how much variability exists in a set of values, around the mean of these values
Standard Deviation
- σ = SD
- Variance = (SD)2
Measures of Dispersion:
an estimate of how much variability exists in a (theoretical) set of sample means around the true population mean
Standard Error
- σ = SD
- n = sample size
- SE = σ/√n
- SE ↓ as n ↑
Normal Distribution
- Gaussian, also called bell-shaped.
- Mean = Median = Mode
Non-Normal Distributions:
- suggests two different populations
- metabolic polymorphism such as fast vs. slow acetylators
- age at onset of Hodgkin lymphoma
- suicide rate by age
Bimodal

Non-Normal Distributions:
- Mean > Median > Mode
- asymmetry with longer tail on right
Positive Skew
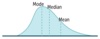
Non-Normal Distributions:
- Mean < Median < Mode
- asymmetry with longer tail on left
Negative Skew
Statistical Hypotheses:
- hypothesis of no difference or relationship
- there is no association between the disease and the risk factor in the population
Null (H0)
Statistical Hypotheses:
- hypothesis of some difference or relationship
- there is some association between the disease and the risk factor in the population
Alternative (H1)
Outcomes of Statistical Hypothesis Testing:
- stating that there is an effect or difference when one exists (null hypothesis rejected in favor of alternative hypothesis)
- stating that there is no effect or difference when none exists (null hypothesis not rejected)
Correct Result

Outcomes of Statistical Hypothesis Testing:
- incorrect result
- stating that there is an effect or difference when none exists (null hypothesis incorrectly rejected in favor of alternative hypothesis).
- p is judged against a preset __ level of significance (usually 0.05)
- if p < 0.05, then there is less than a 5% chance that the data will show something that is not really there
Type I Error (α)
- false-positive error
- α is the probability of making a type I error
- α = you accused an innocent man.
- You can never “prove” the alternate hypothesis, but you can reject the null hypothesis as being very unlikely.

Outcomes of Statistical Hypothesis Testing:
- stating that there is not an effect or difference when one exists (null hypothesis is not rejected when it is in fact false).
- __ is related to statistical power (1 – __), which is the probability of rejecting the null hypothesis when it is false
Type II Error (β)
- false-negative error
- β is the probability of making a type II error
- β = you blindly let the guilty man go free
- If you ↑ sample size, you ↑ power; there is power in numbers.
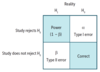
↑ power and ↓ β by _____.
- ↑ sample size
- ↑ expected effect size
- ↑ precision of measurement
_____ is the range of values within which the true mean of the population is expected to fall, with a specified probability.
Confidence Interval
- CI for sample mean = x¯ ± Z(SE)
- The 95% CI (corresponding to α = .05) is often used.
- 95% CI → Z = 1.96
- 99% CI → Z = 2.58
Confidence Interval:
If the 95% CI for a mean difference between 2 variables includes 0, then _____.
- there is no significant difference
- H0 is not rejected
Confidence Interval:
If the 95% CI for odds ratio or relative risk includes 1, _____.
H0 is not rejected
Confidence Interval:
If the CIs between 2 groups do not overlap, _____.
statistically significant difference exists
Confidence Interval:
If the CIs between 2 groups overlap, _____.
usually no significant difference exists
_____ is a method of statistical analysis that pools summary data (eg. means, RRs) from multiple studies for a more precise estimate of the size of an effect. It also estimates heterogeneity of effect sizes between studies. It improves strength of evidence and generalizability of study findings. It is limited by quality of individual studies and bias in study selection.
Meta-Analysis
Statistical Tests:
- checks differences between means of 2 groups
- comparing the mean blood pressure between men and women
T-Test
Tea is meant for 2.
Statistical Tests:
- checks differences between means of 3 or more groups
- comparing the mean blood pressure between members of 3 different ethnic groups
ANOVA
3 words: ANalysis Of VAriance
Statistical Tests:
- checks differences between 2 or more percentages or proportions of categorical outcomes (not mean values)
- comparing the percentage of members of 3 different ethnic groups who have essential hypertension
Chi-square (χ²)
Chi-tegorical
Pearson Correlation Coefficient
- r is always between −1 and +1
- The closer the absolute value of r is to 1, the stronger the linear correlation between the 2 variables.
- Positive r value → positive correlation (as one variable ↑, the other variable ↑).
- Negative r value → negative correlation (as one variable ↑, the other variable ↓).
- Coefficient of determination = r2 (amount of variance in one variable that can be explained by variance in another variable).

Core Ethical Principles
- Autonomy
- Beneficence
- Nonmaleficence
- Justice
Core Ethical Principles:
- respect patients as individuals (truth-telling, confidentiality)
- create conditions necessary for autonomous choice (informed consent)
- honor their preference in accepting or not accepting medical care
Autonomy
Core Ethical Principles:
- Physicians have a special ethical (fiduciary) duty to act in the patient’s best interest.
- may conflict with autonomy (an informed patient has the right to decide) or what is best for society (eg. mandatory TB treatment)
- Traditionally, patient interest supersedes.
Beneficence
Core Ethical Principles:
- “Do no harm.”
- must be balanced against beneficence
- If the benefits outweigh the risks, a patient may make an informed decision to proceed (most surgeries and medications fall into this category).
Nonmaleficence
Core Ethical Principles:
- treat persons fairly and equitably
- does not always imply equally (eg. triage)
Justice
Informed consent is a process (not just a document/signature) that requires _____.
- Disclosure: discussion of pertinent information
- Understanding: ability to comprehend
- Capacity: ability to reason and make one’s own decisions (distinct from competence, a legal determination)
- Voluntariness: freedom from coercion and manipulation
Patients must have an intelligent understanding of their diagnosis and the risks/benefits of proposed treatment and alternative options, including no treatment. Patient must be informed that he or she can revoke written consent at any time, even orally.
Exceptions to Informed Consent
WIPE it away:
- Waiver—patient explicitly waives the right of informed consent
- Legally Incompetent—patient lacks decision-making capacity (obtain consent from legal surrogate)
- Therapeutic Privilege—withholding information when disclosure would severely harm the patient or undermine informed decision-making capacity
- Emergency Situation—implied consent may apply
Consent for Minors
- A minor is generally any person < 18 years old.
- Parental consent laws in relation to healthcare vary by state.
- In general, parental consent should be obtained, but exceptions exist for emergency treatment (eg. blood transfusions) or if minor is legally emancipated (eg. married, self supporting, or in the military).
- Physicians should always encourage healthy minor-guardian communication.
- Physician should seek a minor’s assent even if their consent is not required.
Situations in which Parental Consent is Inessential
- Sex (contraception, STIs, pregnancy)
- Drugs (substance abuse)
- Rock and Roll (emergency/trauma)
Decision-Making Capacity
- Physician must determine whether the patient is psychologically and legally capable of making a particular healthcare decision.
- Note that decisions made with capacity cannot be revoked simply if the patient later loses capacity.
- Capacity is determined by a physician for a specific healthcare-related decision (eg. to refuse medical care).
- Competency is determined by a judge and usually refers to more global categories of decision making (eg. legally unable to make any healthcare-related decision).
Decision-Making Capacity Components
GIEMSA:
- Decision is consistent with patient’s values and Goals
- Patient is Informed (knows and understands)
- Patient Expresses a choice
- Decision is not a result of altered Mental status (eg. delirium, psychosis, intoxication) or Mood disorder
- Decision remains Stable over time
- Patient is ≥ 18 years of Age or otherwise legally emancipated
_____ are instructions given by a patient in anticipation of the need for a medical decision. Details vary per state law.
Advance Directives
Advance Directives:
- incapacitated patient’s prior oral statements commonly used as guide
- problems arise from variance in interpretation
- if patient was informed, directive was specific, patient made a choice, and decision was repeated over time to multiple people, then the oral directive is more valid
Oral Advance Directive
Advance Directives:
- specifies specific healthcare interventions that a patient anticipates he or she would accept or reject during treatment for a critical or life-threatening illness
- living will
Written Advance Directive
Advance Directives:
- patient designates an agent to make medical decisions in the event that he/she loses decision-making capacity
- patient may also specify decisions in clinical situations
- can be revoked by patient if decision-making capacity is intact
- more flexible than a living wil
Medical Power of Attorney
Advance Directives:
- prohibits cardiopulmonary resuscitation (CPR)
- other resuscitative measures that may follow (eg. intubation) are also typically avoided
Do Not Resuscitate Order (DNR)
Surrogate Decision-Maker
- If a patient loses decision-making capacity and has not prepared an advance directive, individuals (surrogates) who know the patient must determine what the patient would have done.
- Priority of Surrogates: spouse → adult Children → Parents → Siblings → other relatives (the spouse ChiPS in)
Ethical Situations:
Patient is not adherent.
- Attempt to identify the reason for nonadherence and determine his/her willingness to change.
- Do not coerce the patient into adhering and do not refer him/her to another physician.
Ethical Situations:
Patient desires an unnecessary procedure.
- Attempt to understand why the patient wants the procedure and address underlying concerns.
- Do not refuse to see the patient and do not refer him/her to another physician.
- Avoid performing unnecessary procedures.
Ethical Situations:
Patient has difficulty taking medications.
- Provide written instructions.
- Attempt to simplify treatment regimens.
- Use teach-back method (ask patient to repeat regimen back to physician) to ensure comprehension.
Ethical Situations:
Family members ask for information about the patient’s prognosis.
Avoid discussing issues with relatives without the patient’s permission.
Ethical Situations:
A patient’s family member asks you not to disclose the results of a test if the prognosis is poor because the patient will be “unable to handle it.”
- Attempt to identify why the family member believes such information would be detrimental to the patient’s condition.
- Explain that as long as the patient has decision-making capacity and does not indicate otherwise, communication of information concerning his/her care will not be withheld.
- However, if you believe the patient might seriously harm himself or others if informed, then you may invoke therapeutic privilege and withhold the information.
Ethical Situations:
A 17-year-old girl is pregnant and requests an abortion.
- Many states require parental notification or consent for minors for an abortion.
- Unless there are specific medical risks associated with pregnancy, a physician should not sway the patient’s decision for, or against, an elective abortion (regardless of maternal age or fetal condition).
Ethical Situations:
A 15-year-old girl is pregnant and wants to keep the child. Her parents want you to tell her to give the child up for adoption.
- The patient retains the right to make decisions regarding her child, even if her parents disagree.
- Provide information to the teenager about the practical issues of caring for a baby.
- Discuss the options, if requested.
- Encourage discussion between the teenager and her parents to reach the best decision.
Ethical Situations:
A terminally ill patient requests physician assistance in ending his/her own life.
- In the overwhelming majority of states, refuse involvement in any form of physician-assisted suicide.
- Physicians may, however, prescribe medically appropriate analgesics that coincidentally shorten the patient’s life.
Ethical Situations:
Patient is suicidal.
- Assess the seriousness of the threat.
- If it is serious, suggest that the patient remain in the hospital voluntarily; patient can be hospitalized involuntarily if he/she refuses.
Ethical Situations:
Patient states that he/she finds you attractive.
- Ask direct, closed-ended questions and use a chaperone if necessary.
- Romantic relationships with patients are never appropriate.
- It may be necessary to transition care to another physician.
Ethical Situations:
A woman who had a mastectomy says she now feels “ugly.”
- Find out why the patient feels this way.
- Do not offer falsely reassuring statements (eg. “You still look good”).
Ethical Situations:
Patient is angry about the long time he/she spent in the waiting room.
- Acknowledge the patient’s anger, but do not take a patient’s anger personally.
- Apologize for any inconvenience.
- Stay away from efforts to explain the delay.
Ethical Situations:
Patient is upset with the way he/she was treated by another doctor.
- Suggest that the patient speak directly to that physician regarding his/her concerns.
- If the problem is with a member of the office staff, tell the patient you will speak to that person.
Ethical Situations:
An invasive test is performed on the wrong patient.
Regardless of the outcome, a physician is ethically obligated to inform a patient that a mistake has been made.
Ethical Situations:
A patient requires a treatment not covered by his/her insurance.
- Never limit or deny care because of the expense in time or money.
- Discuss all treatment options with patients, even if some are not covered by their insurance companies.
Ethical Situations:
A 7-year-old boy loses a sister to cancer and now feels responsible.
- At ages 5–7, children begin to understand that death is permanent, that all life functions end completely at death, and that everything that is alive eventually dies.
- Provide a direct, concrete description of his sister’s death.
- Avoid clichés and euphemisms.
- Reassure the boy that he is not responsible.
- Identify and normalize fears and feelings.
- Encourage play and healthy coping behaviors (eg. remembering her in his own way).
Ethical Situations:
Patient is victim of intimate partner violence.
- Ask if patient is safe and has an emergency plan.
- Do not necessarily pressure patient to leave his or her partner, or disclose the incident to the authorities (unless required by state law).
Ethical Situations:
Patient wants to try alternative or holistic medicine.
Find out why and allow patient to do so as long as there are no contraindications, medication interactions, or adverse effects to the new treatment.
Ethical Situations:
Physician colleague presents to work impaired.
- If impaired or incompetent, colleague is a threat to patient safety.
- Report the situation to local supervisory personnel.
- Should the organization fail to take action, alert the state licensing board.
Ethical Situations:
Patient is officially determined to suffer brain death. Patient’s family insists on maintaining life support indefinitely because patient is still moving when touched.
- Gently explain to family that there is no chance of recovery, and that brain death is equivalent to death.
- Movement is due to spinal arc reflex and is not voluntary.
- Bring case to appropriate ethics board regarding futility of care and withdrawal of life support.
Ethical Situations:
A pharmaceutical company offers you a sponsorship in exchange for advertising its new drug.
- Reject this offer.
- Generally, decline gifts and sponsorships to avoid any appearance of conflict of interest.
- The AMA Code of Ethics does make exceptions for gifts directly benefitting patients; gifts of minimal value; special funding for medical education of students, residents, fellows; grants whose recipients are chosen by independent institutional criteria; and funds that are distributed without attribution to sponsors.
Ethical Situations:
An adult refuses care because it is against his/her religious beliefs.
- Work with the patient by either explaining the treatment or pursuing alternative treatments.
- However, a physician should never force a competent adult to receive care if it is contrary to the patient’s religious beliefs.
Ethical Situations:
Mother and 15-year-old daughter are unresponsive following a car accident and are bleeding internally. Father says do not transfuse because they are Jehovah’s Witnesses.
- Transfuse daughter, but do not transfuse mother.
- Emergent care can be refused by the healthcare proxy for an adult, particularly when patient preferences are known or reasonably inferred, but not for a minor based solely on faith.
Ethical Situations:
A 2-year-old girl presents with injuries inconsistent with parental story.
- Contact child protective services and ensure child is in a safe location.
- Physicians are required by law to report any reasonable suspicion of child abuse or endangerment.
Confidentiality
- Confidentiality respects patient privacy and autonomy.
- If the patient is incapacitated or the situation is emergent, disclosing information to family and friends should be guided by professional judgment of patient’s best interest.
- The patient may voluntarily waive the right to confidentiality (eg. insurance company request).
General Principles for Exceptions to Confidentiality
- potential physical harm to others is serious and imminent
- likelihood of harm to self is great
- no alternative means exist to warn or to protect those at risk
- physicians can take steps to prevent harm
Exceptions to Patient Confidentiality
“The physician’s good judgment SAVED the day.”
- Suicidal/homicidal patients
- Abuse (children, elderly, and/or prisoners)
- Duty to protect—state-specific laws that sometimes allow physician to inform or somehow protect potential Victim from harm
- Epileptic patients and other impaired automobile drivers
- Reportable Diseases (eg. STIs, hepatitis, food poisoning)—physicians may have a duty to warn public officials, who will then notify people at risk; dangerous communicable diseases, such as TB or Ebola, may require involuntary treatment
Children should ride in rear-facing car seats until they are _____.
2 years old
Children should ride in car seats with a harness until they are _____.
4 years old
Older children should use a booster seat until they are _____ or until the seat belt fits properly.
8 years old
Children _____ should not ride in a seat with a front-facing airbag.
< 12 years old
Sexual Changes in the Elderly
- Men—slower erection/ejaculation, longer refractory period
- Women—vaginal shortening, thinning, and dryness
Sleep Pattern Changes in the Elderly
- ↓ REM and slow-wave sleep
- ↑ sleep onset latency
- ↑ early awakenings
Changes in the Elderly:
- ↑ suicide rate
- ↓ vision and hearing
- ↓ immune response
- ↓ renal, pulmonary, and GI function
- ↓ muscle mass
- ↑ fat
- intelligence does not decrease
Disease Prevention:
- prevent disease before it occurs
- HPV vaccination
Primary Disease Prevention
Disease Prevention:
- screen early for and manage existing but asymptomatic disease
- Pap smear for cervical cancer
Secondary Disease Prevention
Disease Prevention:
- treatment to reduce complications from disease that is ongoing or has long-term effects
- chemotherapy
Tertiary Disease Prevention
Disease Prevention:
- identifying patients at risk of unnecessary treatment, protecting from the harm of new interventions
- electronic sharing of patient records to avoid duplicating recent imaging studies
Quaternary Disease Prevention
Major Medical Insurance Plans:
- restricted to limited panel (except emergencies)
- no referral required
Exclusive Provider Organization
Major Medical Insurance Plans:
- restricted to limited panel (except emergencies)
- denied for any service that does not meet established, evidence-based guidelines
- requires referral from primary care provider
Health Maintenance Organization
Major Medical Insurance Plans:
- patient can see providers outside network
- higher copays and deductibles for out-ofnetwork services
- requires referral from primary care provider
Point of Service
Major Medical Insurance Plans:
- patient can see providers outside network
- higher copays and deductibles for all services
- no referral required
Preferred Provider Organization
_____ are federal social healthcare programs that originated from amendments to the Social Security Act.
- Medicare
- Medicaid
_____ is available to patients ≥ 65 years old, < 65 with certain disabilities, and those with end-stage renal disease.
Medicare
MedicarE is for the Elderly.
_____ is joint federal and state health assistance for people with limited income and/or resources.
Medicaid
MedicaiD is for the Destitute.
4 Parts of Medicare:
- Part A: HospitAl insurance, home hospice care
- Part B: Basic medical bills (eg. doctor’s fees, diagnostic testing)
- Part C: (parts A + B = Combo) delivered by approved private companies
- Part D: Prescription Drugs
_____ is medical care focused on providing comfort and palliation instead of definitive cure. Available to patients on Medicare or Medicaid and in most private insurance plans whose life expectancy is < 6 months.
Hospice Care
During end-of-life care, priority is given to improving the patient’s comfort and relieving pain (often includes opioid, sedative, or anxiolytic medications). Facilitating comfort is prioritized over potential side effects (eg. respiratory depression). This prioritization of positive effects over negative effects is known as the _____.
Principle of Double Effect
Common Causes of Death (US):
< 1 y.o.
- Congenital Malformations
- Preterm Birth
- SIDS
Common Causes of Death (US):
1-14 y.o.
- Unintentional Injury
- Cancer
- Congenital Malformations
Common Causes of Death (US):
15-25 y.o.
- Unintentional Injury
- Suicide
- Homicide
Common Causes of Death (US):
35-44 y.o.
- Unintentional Injury
- Cancer
- Heart Disease
Common Causes of Death (US):
45-64 y.o.
- Cancer
- Heart Disease
- Unintentional Injury
Common Causes of Death (US):
65+ y.o.
- Heart Disease
- Cancer
- Chronic Respiratory Disease
Hospitalized Conditions with Frequent Readmissions:
Medicare
*defined as readmission for any reason within 30 days of discharge from original admission
- Congestive HF
- Septicemia
- Pneumonia
Hospitalized Conditions with Frequent Readmissions:
Medicaid
*defined as readmission for any reason within 30 days of discharge from original admission
- Mood Disorders
- Schizophrenia/Psychotic Disorders
- Diabetes Mellitus with Complications
Hospitalized Conditions with Frequent Readmissions:
Private Insurance
*defined as readmission for any reason within 30 days of discharge from original admission
- Maintenance of Chemotherapy or Radiotherapy
- Mood Disorders
- Complications of Surgical Procedures or Medical Care
Hospitalized Conditions with Frequent Readmissions:
Uninsured
*defined as readmission for any reason within 30 days of discharge from original admission
- Mood Disorders
- Alcohol-Related Disorders
- Diabetes Mellitus with Complications
_____ is an organizational environment in which everyone can freely bring up safety concerns without fear of censure. Facilitates error identification. Event reporting systems collect data on errors for internal and external monitoring.
Safety Culture
Human Factors Design
- Forcing functions (those that prevent undesirable actions [eg. connecting feeding syringe to IV tubing]) are the most effective.
- Standardization improves process reliability (eg. clinical pathways, guidelines, checklists).
- Simplification reduces wasteful activities (eg. consolidating electronic medical records).
- Deficient designs hinder workflow and lead to staff workarounds that bypass safety features (eg. patient ID barcodes affixed to computers due to unreadable wristbands).
PDSA Cycle
Process improvement model to test changes in real clinical setting. Impact on patients:
- Plan—define problem and solution
- Do—test new process
- Study—measure and analyze data
- Act—integrate new process into regular workflow

Quality Measurements:
- physical equipment, resources, and facilities
- number of diabetes educators
Structural
Quality Measurements:
- performance of system as planned
- percentage of diabetic patients whose HbA1c was measured in the past 6 months
Process
Quality Measurements:
- impact on patients
- average HbA1c of patients with diabetes
Outcome
Quality Measurements:
- impact on other systems/outcomes
- incidence of hypoglycemia among patients who tried an intervention to lower HbA1c
Balancing
Swiss Cheese Model
- Focuses on systems and conditions rather than an individual’s error.
- The risk of a threat becoming a reality is mitigated by differing layers and types of defenses.
- Patient harm can occur despite multiple safeguards when “the holes in the cheese line up.”
Types of Medical Errors:
- occurs at level of frontline operator (eg. wrong IV pump dose programmed)
- immediate impact
Active Error
Types of Medical Errors:
- occurs in processes indirect from operator but impacts patient care (eg. different types of IV pumps used within same hospital)
- accident waiting to happen
Latent Error
Medical Error Analysis:
- retrospective approach
- applied after failure event to prevent recurrence
- uses records and participant interviews to identify all the underlying problems (eg. process, people, environment, equipment, materials, management) that led to an error.
Root Cause Analysis
Medical Error Analysis:
- forward-looking approach
- applied before process implementation to prevent failure occurrence
- uses inductive reasoning to identify all the ways a process might fail and prioritizes them by their probability of occurrence and impact on patients
Failure Mode and Effects Analysis
