Lecture 14- Review of the evidence Flashcards
(28 cards)
Epidemiological study designs

Evidence-based healthcare
- Healthcare service and intervention should be based on best evidence
- Need rigorous research
- Primary e.g. RCT
- Literature review of studies:
-
Narrative reviews
- Implicit assumptions
- Opaque
- Methodology
- Not reproducible biased, subjective
-
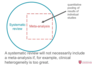
Systematic review
- Explicit assumptions
- Transparent methodology (e.g. search strategy)
- Reproducible
- Unbiased and objective
-
Narrative reviews
-
Decision analyses
- Harm and benefits
- Cost-effectiveness
- Need rigorous research
systematic rveiw
an overview of primary studies that used explicit and reproducible methods

meta-analysis
a quantitative synthesis of the result of two or more primary studies that addressed the same hypothesis in the same way
why are systematic such a credible source of evidence
- Clear focussed question
- Explicit statements about:
- types of study
- types of participants
- types of interventions
- types of outcome measures
- Systematic literature search
- Methodology should be published
- Selection of material
- Appraisal
- Synthesis (possibly including a metanalysis
purpose of a meta-analysis
To facilitate the synthesis of a large number of study results
- Systematically collate study results
- Reduce problems of interpretation due to variation in sampling
- To quantify effect sizes and their uncertainty as a pooled estimate
quality criteria for meta-analysis
Should have a formal protocol (comprehensive search strategy and systematic method of reviewing each study for inclusion
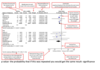
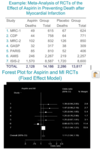
Example – binary outcomes (e.g. dead or alive after certain time period)

Effect size calculated using Odds ratio
Forest plot study numbers 1-7 matches studies from previous example
- Horizontal line= 95% confidence intervals
- If it crosses 1- no significant difference in outcomes (5%)
- Square= effect
- Diamond= metanalyses estimates

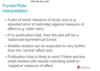
Interpretation of forest plot
- Individual odds ratios [squares] with their 95% CI [lines] are displayed for each study
- Size of square is in proportion to the weight given to the study
- The [diamond] is the pooled estimate with the centre indicating the pooled odds ratio [dotted line] and the width representing the pooled 95% CI
- The [solid line] is the null hypothesis OR
- 1= no difference
- 6 out of the 7 RCTs had an OR > 1.00 indicating greater odds for survival amongst patients taking aspirin after MI
- Only 1 RCT (the largest) had a statistically significant result, but its OR was less than the other RCTs with an OR > 1.00
- Pooled estimate OR = 1.11 (95% CI: 1.04 to 1.19) leads to the conclusion that aspirin increases the chance of surviving after a MI (p<0.05)
Meta-analysis problems
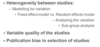
(1) Heterogeneity between studies : modelling for variation
Two approaches to calculating the pooled estimate odds ratio and its 95% Cl:
Heterogeneity
in meta-analysis refers to the variation in study outcomes between studies
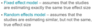
fixed effect model
Assumes there is only one true effect that every study is trying to estimate- variation in effects is due random variation
- Studies are weighted for uncertainty
- Smaller confidence interval studies will have greater weight

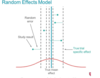
random effect model
True mean effect= average of dashed vertical lines
- Each individual study measures different treatment effect
- Any difference between the true trial specific effect (dashed line) and study result is due to random error
forest plot for same meta-analysis using fixed effect and random effects model
Difference: size of boxed= a little more equal in random effects model
- Don’t want to let big study dominant weight
- Want to see effect of smaller studies contributing more equally

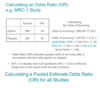
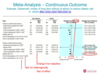
Example 2- Continuous outcome e.g. BP
Null value = 0 = no change in BP
- Shows significant changes in systolic blood pressure (top of graph)
- Diamond doesn’t cross 0
- Insignificant change in diastolic bp (bottom of graph
- Crosses 0
Heterogeneity between studies: Analysing variation
- Random effects modelling can only account for variation but not explain it
- Sub-group analysis can help to explain heterogeneity which may provide further insight into the effect of a treatment or exposure
- Study characteristics (e.g. year of publication, length of follow up, %female participants)
- Participant profile – where data is analysed by types of participants (e.g. subgroups of males, females, adults, children)
Variable quality of the studies: the issues
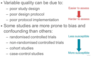
Variable quality of the studies:the approaches
The approaches: 2 tend to be used
- Define a basic quality standard and only include studies satisfying this criteria e.g. Cochrane reviews used to include only RCTs
- Score each study for its quality and then
- incorporate the quality score into the weighting allocated to each study during the modelling, so that higher quality studies have a greater influence on the pooled estimate
- use sub-group analyses to explore differences, e.g. high quality studies vs. low quality studies
- Score each study for its quality and then
Assessing the quality of the studies
For RCTs, many scales available – e.g. CHEERs

Publication bias and selection of studies
- Studies with statistically significant or ‘favourable’ results are more likely to be published than those studies with non- statistically significant or ‘unfavourable’ results
- this applies particularly to smaller studies
- Any systematic review or meta-analysis can be flawed by such bias
- publication bias leads to a biased selection of studies towards demonstration of effect
methods of identification
- Check meta-analysis protocol for method of identification of studies
- should include searching and identification of unpublished studies
- Plot results of identified studies against a measure of their size (e.g. inverse of standard error), i.e. a Funnel Plot
- Use a statistical test for publication bias – they tend to be weak statistical tests