Statistics Flashcards
(184 cards)
Definition
one type of inferential statistics. It is used to determine whether there is a significant difference between the means of two groups. With all inferential statistics, we assume the dependent variable fits a normal distribution
T test
What is the internal and external validity rated for an quasi-experimental study?
Internal: medium
External: medium
What is a two-way ANOVA?
An ANOVA with 2 factors (IVs)
What is contrasts?
The between treatment variability is explained by the experimental manipulation – i.e., is due to participants being assigned to different groups
What do you do if homogeneity is violated in an ANOVA?
- If sample sizes are large and equal…
- ANOVA can handle normality violation
- If sample sizes are small or not equal…
- Use the Brown-Forsythe or Welch F ratio (and their associated p and df; Welch is more powerful) instead of the regular F ratio
Define
T test
one type of inferential statistics. It is used to determine whether there is a significant difference between the means of two groups. With all inferential statistics, we assume the dependent variable fits a normal distribution
What are some threats to external validity?
- Generalising across participants or subjects
- Generalising across features of a study
- Generalising across features of the measures
Definition
the validity of applying the conclusions of a scientific study outside the context of that study. Tt is the extent to which the results of a study can be generalized to and across other situations, people, stimuli, and times
External validity
Definition
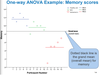
F = variance between sample means / variance expected by chance
F statistic
t-Tests are “difference tests”. Used to compare mean differences between up to ____groups or conditions
t-Tests are “difference tests”. Used to compare mean differences between up to two groups or conditions
Define
Type I error
the rejection of a true null hypothesis (also known as a “false positive” finding or conclusion)
Definition
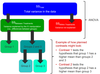
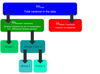
a collection of statistical models and their associated estimation procedures (such as the “variation” among and between groups) used to analyze the differences among group means in a sample
ANOVA
What do you use in a post hoc test is there are unequal variances?
Games-Howell
Define
Confounding variable
factors other than the independent variable that may cause a result
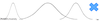
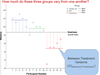
What does witihin treatment variance look like on this graph?

What is the experiment-wise error rate of an analysis that uses 3 comparisons at an alpha level or .05?
αEW = 1 - (1 - αTW)c
αEW = 1 - (1 - .05)3
αEW = 1 - .953
αEW = .14
14% chance of comitting at least 1 type I error
What test is used to assess normality?
Shapiro-Wilk
Definition
An experimental design that that looks a bit like an experimental design but lacks the key ingredient – random assignment
Quasi-experiment design
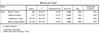
What is the internal and external validity rated for an experimental study?
Internal: high
Externl: low
Definition
A type of reseach used to assess changes over an extended period of time
Developmental research
How do you minimise participant attrition?
- Increase sample size and measure/ compare participants who do/don’t withdraw
What does a positive t-value tell you?
That the mean for condition/sample 1 is higher than the mean for condition/sample 2
What is the non-parametric alternative to a one-way repeated-measures ANOVA?
Friedman’s test
How do you minimise environmental variables?
- Standard experimental procedures, setting, and experimenter