Lecture 12- The ECG Flashcards

1
Q

The conduction system

A
  1. SA node sends an AP which spreads across atria causing contraction
  2. AP reaches the AV node, which transmits the AP to the bundle of His through the annulus fibrosus (separates atria from ventricles)
  3. Bundle of His divides into:
    • Right bundle branch- travels along right side of interventricular septum- excising right ventricle
    • Left bundle branch- travels along left side of interventricular septum- excites left ventricle
  4. Right and left bundle branch terminate in extensive network of conducting fibres called purkinje fibresà continue wave of depolarisation through the ventricles
  5. The impulse conducts across the ventricular myocardium causing contraction
2
Q

Annulus fibrosis

A
  • Anchors myocardium and cardiac valves
  • Electrical insulator between atria and ventricles
  • Consists of 4 fibrous rings (coloured blue)
3
Q

conducting system of the ehart and heart rate: Atria SAN

A
  • Fastest rate of depolarisation in the heart
  • Intrinsic firing rate 60-100 times/minute
  • Sets heart rate and rhythm- sinus rhythm
4
Q

conducting system of the ehart and heart rate: atria AVN

A
  • Slow conduction
  • Gives time for atria to contract before ventricles
  • Intrinsic firing rate without stimulation (such as from the SA node)- 40-60 times/minute
5
Q

conducting system of the ehart and heart rate: ventricles left and right bundle branch

A
  • Ventricular electrical conducting system cells also have an intrinsic firing rate although not typically manifested
  • Intrinsic firing rare 20-40 times/minute - SLLOW
6
Q

ECG basics

A
  • Records cardiac electrical activity as transmitted to chest wall and limbs
  • The signals sent throughout the heart by the conduction system can be picked up on an ECG.
7
Q

electrodes

A

the wires you place on the body

8
Q

Lead

A

describes the view of the hearts and the recordings on the ECG

9
Q

how many electrodes used in a 12-lead ECG

A

10 electrodes are placed on patients body to give 12 views of the heart

10
Q

how many limb electrodes

A

4

11
Q

how many chest electrodes

A

6 ‘precordial’ electrodes

12
Q

4 limb electrodes are placed on

A

bony parts of the body e.g. wrists and ankles

(Ride your green bike- from right wrist and working clockwise when looking at the front of the patient)

13
Q

red electrode

A

right arm

14
Q

yellow electrode

A

left arm

15
Q

green electrode

A

left leg

16
Q

black elecrode

A

right leg

  • not used for any leads/views
17
Q

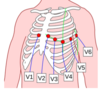
name the 6 chest electrodes (precordial)

A

V1- right sternal edge (4 th intercostal space (ICS)

V2- left sternal edge (4th ICS)

V3- half way between V2 and V4

V4- mid-clavicular line, 5th ICS

V5- hallway between V4 and V6

V6- mid-axillary line in line with V4

18
Q

placement of chest electrodes

A
  1. V1- right sternal edge (4 th intercostal space (ICS)
  2. V2- left sternal edge (4th ICS)
  3. V3- half way between V2 and V4
  4. V4- mid-clavicular line, 5th ICS
  5. V5- hallway between V4 and V6
  6. V6- mid-axillary line in line with V4

It is usually best to place leads V1, V2, V4 and V6 first to help with placement of V3 and V5

19
Q

each lead/view

A

–> Each lead/view of the ECG looks at a different part of the heart and is associated with a coronary artery

Multiple leads give us different views of the heart and allows us to see where pathology is- important in myocardial infarction in order to deduce which coronary artery is affected

20
Q

lateral chest leads

A

V6, V5, V4

21
Q

anterior leads

A

V4, V3, V2

22
Q

septal leads

A

V1, V2

23
Q
A
24
Q

V1- V6 are knwon as

A

the anterior leads

  • they ;ook at the front of the ehart
25
V1 and V2
look at the right ventricle and interventricular septum
26
V3 and V4
look at the anterior surface of the ventricle
27
V5 and V6
look at part of the left ventricle
28
two types of lead
Bipolar and unipolar
29
bipolar leads
a lead composed of 2 electrons of opposite polarity
30
unipolarity
leads fomposed of a single positive electrode and reference point
31
which limb leads are bipolar
I,II, III
32
which limb leads are unipolar
AVR, AVL, AVF
33
unipolar chest leads
all of them
34
limb lead I
- right arm negative - left arm positive
35
limb lead II
- right arm negative - left leg positive
36
limb lead III
- left arm negative - left leg positive
37
limb leads I, II and III combined
38
augmented wires
AVR- right arm AVL- left arm AVF- foot
39
40
all limb leads combines makes the
hexial reference system
41
Whether the electrical activity of the heart is going towards or away from the electrode
gives either an upward or downward deflection
42
Depolarisation towards the electrode is seen as
an upward deflection, e.g. when the impulse is travelling down the septum, this gives the upwards part of the QRS complex.
43
Depolarisation away from the electrode is seen as
a downward deflection, e.g. when the impulse is travelling up the ventricles, this gives the downwards part of the QRS complex.
44
Repolarisation towards the electrode is seen as
a downward deflection.
45
Repolarisation away from the electrode is seen as
an upward deflection
46
Height of deflection depends on
how directly depolarisation wave is coming towards (or going away) from positive electrode and the number of cells generating the signal
47
When talking about how the conduction looks on an ECG normally, we imagine
the positive electrode is at the apex of the heart. This gives us the lead II view of the heart on an ECG.
48
lengths of P wave
80-100ms
49
lengh of delay at AV (isoelectric segment)
80-100ms
50
length of QRS
80-120ms
51
Outline the ECG and how it relates to the conduction system
1. Before atrial depolarisation, the SA node depolarises but the signal is not enough to register on the ECG so it appears as an isoelectric segment (flat line) 2. Then the atrial depolarisation which appears as an upwards deflection as depolarisation spreads towards the ventricles- P wave 3. The impulse reaches the AV node and is delayed after atrial depolarisation- to allow the atria to contract and empty- this appears as another isoelectric segment (PQ segment) 4. Impulse spreads to the ventricles and ventricular depolarisation is now seen as the QRS complex * Depolarisation of the septum happens from left to right- seen as a small downward deflection because moving obliquely away- to the sides (not straight towards positive electrode) -Q wave * Followed by an upwards deflection (R wave) as the depolarisation spreads down the bundle of His * The negative deflection is the S wave and is the wave of depolarisation spreading up the walls of the ventricles via the purkunje fibres away from the positive electrode (small because not moving directly away) 5. Isoelectric segment once ventricular depolarisation is complete 6. Finally ventricular repolarisation occurs which is the T wave
52
U wave
sign of pathology e.g. hypokalaemia
53
each small box equates to
0.04 seconds
54
a large box equates to
0.20 seconds (5 small bozes in the length of one large box)
55
calculating heart rate: regular rhythm
1. Count the number of large boxes between two R waves (count any small boxes as 0.2 of a large box). 2. Then calculate 300/(number of large boxes) which will give the heart rate.
56
calculating heart rate: irregular rhythm
If the patient has an irregular rhythm then the above method will not work as you will get different values depending on which heart beats you use. The following alternative method can be used to calculate the average heart rate: 1. Look at **lead II** on the bottom of the ECG (pacing strip). 2. Count how many times a QRS complex occurs in 30 large squares – 30 large squares is 6 seconds. 3. Times the number of complexes by 10 to give you the HR.
57
58
sinus rhythm
Sinus rhythm is a normal heart rhythm. It is defined as: * A regular rhythm * HR of 60-100bpm * P waves seen * P waves upright in leads I and II * Normal PR interval * Every P wave followed by a QRS * Every QRS preceded by a P wave * Normal QRS width
59
patients cans till have a sinus rhythm depsite being
bradycardic or tachycardic e.g. sinus tachycardia
60
intervals seen in ECG
PR interval QRS interval QT itnerval
61
length of PR intevral
(0.12- 0.2) Interval between the start of the P wave and the start of the Q wave- normally 3-5 small boxes --\> 1 large box is prolonged
62
A prolonged PR interval suggests
delayed conduction through the AV node and bundle of His. Seen in: * Heart block * Ischaemic heart disease * Hypokalaemia
63
A shortened PR interval suggest
that the delay at the AV nodes has not happened. This can be seen: Wolff- Parkinson- white syndrome (faster conduction pathway between atria and ventricles)
64
QRS interval length
(\<0.12) ## Footnote Lengths of the QRS complex (start of the Q wave to the end of the S- 2-3 small boxes)
65
66
A widened QRS interval suggests
that depolarisation is arising ectopically in the ventricles. This means that the wave of depolarisation does not spread via the His- purkinje system so it takes longer for the wave to spread along the walls of the ventricles * Bundle branch block * Hyperkalaemia * Ventricular ectopics
67
QT interval length
(\<0.45 seconds) * 10-12 small boxes Interval between the start if the Q wave and the end of the T wave. * Value varies with heart rate, therefore readings need to be standardised before values can be compared.
68
Prolonged QT interval suggests
a prolonged ventricular repolarisation (associated with dangerous arrythmias)- can be seen in: Use of certain drugs
69
Analysing an ECG
When confronted with an ECG, it's good to have a system in your head that you can use to analyse the ECG and describe it. The following is a suggested order for looking at different aspects of the rhythm strip of an ECG. 1. Calculate the heart rate. 2. Is the rhythm regular or irregular? This can be hard to determine in faster heart rates, so a good technique is to mark the distance between two or three tips of QRS complexes on a piece of paper and slide it across the rhythm strip. If the marks align, then the rhythm is regular. 3. Are there P waves? This suggests atrial activity. 4. Are there QRS complexes? This suggests ventricular activity. 5. Is each P wave followed by a QRS complex, and each QRS complex preceded by a P wave? 6. Measure the intervals: PR interval, QRS width, QT interval. If all of these observations are normal, then the patient has a sinus rhythm, if one or more aspects are abnormal, then this suggests some sort of pathology.
70
71