EL 1&2: Mass spectrometry; fusion; emission/absorption spectra Flashcards
What are the symbols for mass and atomic number?
Mass number = A
Atomic number = Z
What are isotopes?
Atoms of the same element with different mass numbers.
Explain how mass spectrometry works.
- Sample atoms/molecules are ionised to cations, then accelerated by a charged region
- They pass through a drift region (vacuum) then hit a detector
- Ek = 1/2mv2 so isotopes with a higher m/z (mass to charge) ratio have a greater time of flight
How do you work out relative mass when looking at a mass spectrum?
Relative isotopic abundance =
peak height of isotope or relative intensity
total peak height or total intensity
Relative mass =
sum of (relative abundance x mass number)
100
Calculate the relative atomic mass of iron.


The relative atomic mass of iridium is 192.2. It occurs naturally as both iridium-191 and iridium-193. Calculate the % abundance of each isotope.
Let x + y = 100% then y = 100 - x
191x + 193y = 100(192.2)
191x + 193(100 - x) = 19,200
-2x = -80 so x = 40%
y = 100 - 40 = 60%
40% iridium-191; 60% iridium-193

40% antimony-123
60% antimony-121

C
Define nuclear fusion.
The process by which, under high temperature and pressure, lighter nuclei fuse, forming a heavier nucleus of a new element.
Write a nuclear equation for the formation of 3He from hydrogen.


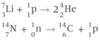
In stars, a reaction called the ‘triple alpha process’ occurs where three helium nuclei fuse together. Write a nuclear equation for this process.

What is spectroscopy?
The study of how light and matter interact.
What equation links the wave and particle theories of light?
E = hν
E = hf
Compare the wavelength and frequency of red and blue visible light.
- Red: lower frequency, longer wavelength
- Blue: higher frequency, shorter wavelength
Give Bohr’s explanation for why an atom only emits or absorbs certain frequencies of light.
- Electrons in atoms exist only in certain energy levels since energy is quantised
- A photon of light is emitted/absorbed when an electron decreases/increases energy level
- Energy of photon = ΔE, difference between energy levels
- Since E = hν, frequency of emitted/absorbed light is related to ΔE by ΔE = hν

- Both arrows point down
- Shorter arrow = red line
Describe the similarities and differences between an emission and absorption spectrum for the same element.
Similarities
- Line spectrums
- Lines in same place; same frequency
- Lines become closer together with higher frequency
Differences
- Absorption: black lines on a rainbow background
- Emission: coloured lines on a black background
How may an atomic spectrum provide information about the abundance of an element?
The intensity of lines provides a measure.
Describe how an atomic emission spectrum is produced.
- Energy transferred to atoms
- Electrons excited from ground state to higher energy level
- They fall back to a lower energy level since energy is quantised
- Photon of light emitted; energy = ΔE, difference between energy levels
- As E = hν, frequency of emitted light is related to ΔE by ΔE = hν
- Radiation detected, producing coloured vertical lines on a black background
The first ionisation enthalpy of sodium is 496 kJ mol-1. Calculate the frequency that corresponds to this energy.
Enthalpy for one atom = 496,000 / (6.02 x 10²³) = 8.239 x 10⁻¹⁹ J
ν = e/h = 8.239 x 10⁻¹⁹ / (6.63 x 10⁻³⁴) = 1.24 x 10¹⁵ Hz (3 s.f.)
Explain why an atomic emission spectrum is unique to a particular element.
- Energy transferred to atoms; electrons excited to higher energy levels then fall back to lower ones
- Photons of light emitted; energy = ΔE, difference between energy levels
- Since E = hν, ΔE = hν
- Energy levels are quantised + unique to each element
- So frequency of light emitted is also unique
- Produces unique colours on spectrum
Explain how the atomic emission spectra of elements show that electrons exist in energy levels.
- They show lines of specific frequencies, rather than a continuous spectrum
- Shows energy is quantised; E = hν
- From violet to red (left to right), frequency of lines decreases
- Shows e- drop down energy levels

D
2 wrong since lower energy levels
3 wrong since higher frequency not wavelength

