Abdomen and Pelvis part 1 Flashcards
figure B 23 was acquired in the (plane)

coronal
figure B 23 is an example of (weighting)
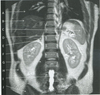
T2
figure B 23 arrow A

right lung
figure B 23 was acquired with

long TR and Long TE
no suppression
figure B 23 arrow B

liver
figure B 23 arrow C

spleen
figure B 23 arrow D

crux of the diaphragm
figure B 23 arrow E

right adrenal gland
figure B 23 arrow F

kidney
figure B 23 arrow G

psoas muscle
figure B 23 arrow H

oblique abdominal juscle
figure B 23 the high signal arising within the abdomen, idicated by arrow I represents

CSF in the spinal canal
figure B 23 arrow J

gluteal muscle
the FDA approved oral contrast agent used in MRI makes bowel appear
dark on T1/dark on T2
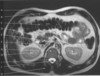
figure B 24 was acquired in the (plane)

axial
figure B 24 is a gradient echo image acquired with

fat suppression
figure B 24 arrow A

abdominal muscles
figure B 24 arrow B

stomach
figure B 24 arrow C

liver
figure B 24 arrow D

bowel
figure B 24 arrow E

portal vein
figure B 24 arrow F

aorta
figure B 24 arrow G

vertebral body
figure B 24 arrow H

spinal cord
figure B 24 arrow I

spleen
due to its size and orientation with in the body, the entire pancreas can possibly be visualized on one imaging sectoin if it is acquired
obliquely with thick sections
on T2 weighted MR images, hemangiomas of the liver appear
hyperintense to the normal liver
figure B 25 arrow A

subcuntaneous fat
figure B 25 arrow B

abdominal muscle
figure B 25 arrow C

transverse colon
figure B 25 arrow D

spuperior mesenteric artery
figure B 25 arrow E

adrenal gland
figure B 25 arrow F

abdominal aorta
figure B 25 arrow G

vertebral body
figure B 25 arrow H

right kidney
figure B 25 arrow I

spinal canal
figure B 25 arrow J

spinal cord
figure B 25 arrow K

erector spinae muscles
figure B 26 arrow A

liver
figure B 26 arrow B

gallbladder
figure B 26 arrow C

head of pancreas
figure B 26 arrow D

tail of pancreas
figure B 26 arrow E

spleen
figure B 26 arrow F

colon
figure B 26 arrow G

body of pancreas
figure B 26 arrow H

abdominal aorta
figure B 26 arrow I

right kidney
figure B 26 arrow J

left kidney
figure B 27 arrow A

liver
figure B 27 arrow B

abdominal aorta
figure B 27 arrow C

spleen
figure B 27 arrow D

right kidney
figure B 27 arrow E

psoas muscle
figure B 27 arrow F

cruz of the diaphragm
figure B 27 arrow G

adrenal gland
figure B 27 arrow H

left kidney
figure B 27 arrow I

lumbar vertebral body
figure B 27 arrow J

intervertebral disk
figure B 28 shows images during various phases of a contrast enhancement including early (arterial-first pass), intermediate (cortico-venous phase-second pass) and delayed phases (third pass). Arterial phase imaging demonstrates all of the following

spleen is hyperintense to the liver
spleen is mottled or marbled enhancement
only the cortex of the kidneys is enhanced
figure B 28 shows images during various phases of contrast enhancement. Most oliver cancers are “arterially” fed and therefore are visualized on

first pass images
figure B 28 show images during various phases of contrast enhancement, Hemangiomas are “benign” lesions (typically watch and wait lesions) that are venous fed, and therefore are visualized on

delayed images
patient positioning for abdominal MR images includes all of the followoing positions
supine, head first within torso array coil
supine feet first with in torso array coil
prone feet first within the torso array coil
figure B 29 arrow A

abdominal aorta
figure B 29 arrow B

splenic artery
figure B 29 arrow C

celica artery
figure B 29 arrow D

hepatic artery
figure B 29 arrow E

superior mesenteric artery
figure B 29 arrow F

right renal artery
figure B 29 arrow G

left renal artery
figure B 29 arrow H

spinal artery
figure B 29 arrow I

common iliac
figure B 29 arrow J

external iliac artery
figure B 29 arrow K

internal iliac artery
vascular imaging of the arterial abdominal vasculature (figure B 29) is typically acquired with

contrast enhanced MRA
ceMRA