Z-scores, Outliers, CIs & Normal Distributions Flashcards
(14 cards)
1
Q
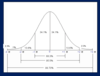
Properties of a normal distribution
A
- The majority of scores lie around the centre
- The mean, median and mode will fall on the mid-point
- The curve is symmetrical around the centre
- Area under curve is directionally proportional to the relative frequency of observations
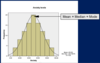
- The majority of scores (approx two thirds) fall within 1 SD either side of the mean
2
Q
Normal distribution and standard deviation
A
3
Q
z-scores
A
- z-scores are standardised scores with a mean of 0 and a SD of 1
- A z-score is just the number of SDs a score is above or below the mean
4
Q
Using z-scores to detect outliers
A
- 99.9% of a sample will have z-scores between -3.29 and +3.29.
- Any z-score below -3.29 and above +3.29 must be an extreme outlier.
5
Q
Dealing with outliers
A
- Remove
- Transormation
Do it BEFORE we test for normal distribution
6
Q
Assumptions of parametric tests
A
- Interval data
- Independent scores
- Normally distributed data
7
Q
Leptokurtosis
A
Very pointed/short tails
8
Q
Platykurtosis
A
Very flat/long tails

9
Q
Mesokurtosis
A
Normal kurtosis

10
Q
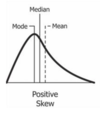
Positive skew
A
Tail on the right side of the distribution is longer or fatter.
11
Q
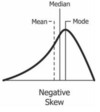
Negative skew
A
The tail of the left side of the distribution is longer or fatter than the tail on the right side
12
Q
Using z-scores to assess normality
A
- Calculate z-score for skewness and kurtosis
- z(skewness)= skewness/SE(skewness)
- z(kurtosis) = kurtosis/SE(kurtosis)
- Small samples (N<100): z-scores below -1.96 or above +1.96 are significant → skew or kurtosis
- Medium samples (N>100): z-scores below -3.29 or above +3.29 are significant → skew or kurtosis
- Large samples (N>300): don’t look at z-score of skewness or kurtosis
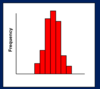
- Look at histogram
- Look at actual raw skew/kurtosis value in table
- Value >2 indicates non-normality
13
Q
Kolmogorov-Smirnov test
A
- Tests for normal distribution
- If significantly different (p<.05), then non-normally distributed
- If non-significant (p>.05), then normally distributed
- K-S test is very sensitive to number of participants therefore not recommended
⇒ Use z-score or histogram to determine normal distribution
14
Q
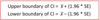
Confidence interval (95% CI)
A
- The range within which the true mean is likely to be in 95% of instances
- Assume population is normally distributed → Then 95% of scores fall between -1.96 and +1.96 SDs either side of the mean.