Correlations Flashcards
(15 cards)
1
Q
Correlation
A
- Examines the relationship between two variables
- Whether they are are associated with each other
- How they are associated with each other
- Cross-sectional design: two measures are taken from each person at a specific time point
2
Q
Regression line
A
- Linear regression is a way to fit the best line (model) to the data
- Regression line = line of best fit
3
Q
Positive relationship
A
As scores one variable increase, scores on another variable increase

4
Q
Negative relationship
A
As one increases the other decreases
5
Q
No relationship
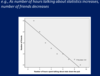
A
No correlation - data points scattered irregularly
6
Q
Perfect correlation
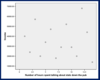
A
All of the data points lie on the line

7
Q
Correlation coefficient
A
- Determines the strength and direction of the relationship by calculating the correlation coefficients
- Direction:
- → positive correlation
- → negative correlation
- Strength: look at value - indicated by a number from -1 to +1
- -1 → perfect negative correlation
- +1 → perfect positive correlation
- 0 → no correlation
- r = .10 = small/weak
- r = 0.30 = medium/moderate
- r = .50 = large/strong
- Direction:
- Two types:
- Pearson’s r: for data that meet assumptions of normality
- Spearman’s rho (rs): for data that violate assumptions of normality
8
Q
Pearson’s r assumptions
A
- Parametric test:
- Interval or ratio data
- Normally distributed data
- Linear:
- Assumes any underlying relationship is linear
9
Q
Pearson’s r formula
A
Ration of how much scores vary ‘together’ compared to how much they vary overall

10
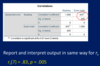
Q
Pearson’s r SPSS output
A
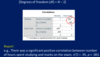
11
Q
Effect size for Pearson’s r
A
- r is itself a measure of effect size - we don’t need anything else
- Cohen’s recommendations:
- r = .10 = small/weak
- r = 0.30 = medium/moderate
- r = .50 = large/strong
12
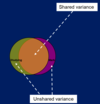
Q
Shared variance R2
A
- If there is a relationship between two variables, then as scores on one change, scores on the other change
- Shared variance = R2 (r x r)
13
Q
Spearman’s rho rs
A
- When our data don’t meet assumptions for parametric tests e.g. ordinal data, skewed data
- First converts scores into ranks and then runs an analysis on the ranks
- Less influenced by single extreme cases
- R<em>2</em> = proportion of variance in ranks that is shared → not useful
14
Q
Spearman’s rho rs SPSS output
A
15
Q
Kendall’s tau
A
- Nonparametric test of correlation
- Ideal for small data sets with a large number of tied (same) ranks
- Can’t square it to get shared variance