Simple Linear Regression Flashcards
(9 cards)
1
Q
Residuals
A
- Difference between observed value (data points) and values predicted by the model (i.e. regression line)
- Residual = (observed value) - (predicted value)

2
Q
Residual sum of squares SSR
A
Square residuals and sum them
3
Q
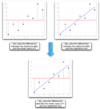
How to determine the line of best fit
A
- Ordinary least squares (OLS) method: line with smallest SSR (error)
4
Q
R-squared R2 in regression
A
- Proportion of variance accounted for by the regression model
- In simple (one predictor) regression, this is the same as the shared variance
- R2 = SSM/SST
- SST = Total variability: variability between the scores and the mean
- SSM: Model variability: difference between the model (line) and the mean
5
Q
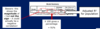
R2 SPSS output
A
6
Q
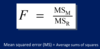
ANOVA (F)
A
- Whether the regression line is a significantly bettwe fit to the data than chance (using the mean as our best guess)
7
Q
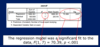
ANOVA (F) SPSS output
A
8
Q
Model parameters
A
Equation for a straight line is y = b0 + b1x
- b<em>0</em> is the constant and the y-intercept
- b1 is the gradient of the line
- y is the outcome variable (DV)
- x is predictor (IV)
9
Q
Model parameter SPSS output
A