Multiple Regression Flashcards
(13 cards)
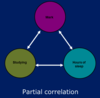
Partial correlation
Correlation between two variables while controlling for a third (a “first-order partial correlation”)
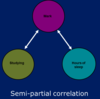
Semi-partial correlation
Relationship between two variables while accounting for the relationship between a third variable and one of those variables
Multiple regression rationale
- Cross-sectional design - when we have measured more than 2 variables
- Increase predicted variance in outcome
- We can determine:
- how well the model explains the outcome
- how much variance in the outcome our model explains
- the importance of each individual predictor
Types of multiple regression
- Forced entry (enter) - all in at once
- Hierarchical - researcher decides order variables are entered in blocks
- Stepwise - SPSS decides the order they are entered
Variance in multiple regression
- R us not particularly useful in multiple regression because we have several variables in the model
- R2 : variance in the model accounted by all predictors
- Adjusted R2: adjusted for number of predictors in model
- An indicator of how well our model generalises. The closer R2 is to adjusted R2 the more accurate our model is likely to be for other samples

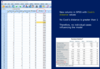
Multiple regression output in SPSS

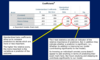
Regression coefficients in SPSS
Use unstandardised beta coefficients for multiple regression equation
Assumptions for multiple regression
Pre-design:
- Outcome variable should be continuous
- Predictor variables should be continuous or dichotomous
- Should have reasonable theoretical ground for including variables
Post-data collection:
- Linearity
- Homoscedasticity/no heteroscedacity
- Normal distribution of residuals
- No multicollinearity
- Influential cases
Linearity
Relationship between each predictor and the outcome should be linear
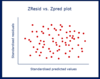
Homoscedasticity/ No heteroscedasticity
- Variance of error term (residuals) should be constant for all values of the predicted values (model)
- Look to see that data points are reasonably spread for all predicted values
- Look at a plot of standardised residuals by standardised predicted values
- Heteroscedasticity: when the variance in the error term is not constant for all predicted values - a funnel/cone shape may indicate heteroscedasticity
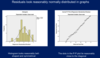
Normal distribution of residuals
In regression it is important that the outcome residuals are normally distributed
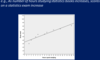
No multicollinearity
- Multicollinearity problems can occur when predictors correlate very strongly: predictors should not correlate too highly (e.g. r>.8 or .9)
- Problem:
- A good predictor might be rejected because a second predictor won’t explain much more unique variance in the outcome than the first predictor
- Leads to error in estimation of regression coefficients (the beta values)
- Possible solutions:
- If it makes sense could try to combine predictors into one single variable
- Might be necessary to remove one of the variables
- In SPSS: look at tolerance or VIF statistic (tolerance = 1/VIF)
- VIF: worry if greater than 10
- tolerance: less than 0.1 is cause for concern (0.2 may also be of concern)
- High R2 with non-significant beta coefficients might also be another indication

Influential cases
- Individual cases (outliers) that overly influence the model
-
Cook’s distance: checks for influential outlier cases in a set of predictors
- Measures the influence of each case on the model
- Values greater than 1 may be a cause of concern