One-way independent ANOVA Flashcards
(11 cards)
1
Q
Limitations of the t-test
A
Familywise error: each additional t-test increases the chance of making a type I error

2
Q
What is ANOVA?
A
- Used like the t-test: to compare 3 or more condition means
- Advantage over t-test: doesn’t increase chances of Type I error
- ANOVA hypothesis tested:
- null hypothesis = means don’t differ
- experimental hypothesis = the means differ
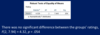
- ANOVA is an omnibus test: it tests for an overall difference between conditions - whether the means differ, but not which means differ
3
Q
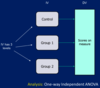
One-way independent ANOVA
A
- 3 or more group means (somes called ‘between-groups ANOVA’)
- One IV
4
Q
Systematic variation
A
Variation due to something the experimenter has manipulated
5
Q
Unsystematic variation
A
Variation that is the result of random factors between conditions
6
Q
Rationale of ANOVA
A
- ANOVA = Analysis of Variance
- Compares systematic to unsystematic variance i.e. how much of the variance is due to our manipulation vs how much is just random variation
- Our manipulation has had an effect on our DV if it has created a lot of variation in scores compared to the random variation we’d find anyway
- Our manipulation has not had an effect on our DV if there is not much variation in scores compared to random variation that we’d find anyway
7
Q
Independent ANOVA by hand
A
- Calculate the within-group variance
- Called within-group sum of squares: SSW (or residual sum of squares SSR)
- Calculate the between-groups variance
- Called between-group sum of squares: SSB (or model sum of squares SSM)
- Effect of our manipulation = between-groups variance/ within-groups variance
- Need to account for degrees of freedom (df):
- For SSW, dfw = sum of participants/scores in each group -1
- For SSB, dfB = k-1 (k = no of conditions/groups)
- Use mean sum of squares (MS): divide the sum of squares by the df
- Final F is MSB/MS<span>W</span> also expressed as MSM/MS<span>R</span>
- The larger the F-value, the less likely that it occurred by chance
- Need to account for degrees of freedom (df):
- Use a table of “critical values of F” to check for significance
8
Q
Assumptions of Independent ANOVA
A
Parametric test:
- Normal distribution
- Data are measured at the interval/ratio level
- Homogeneity of variance
9
Q
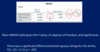
ANOVA SPSS output
A
10
Q
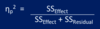
ANOVA effect size
A
- Partial eta squared
- 0.01 = small
- 0.06 = medium
- 0.14 = large
11
Q
Independent ANOVA - if assumption of homogeneity of variance is violated
A
Welch statistic