Week 1 and 2 ( welcome with descripitive stats Flashcards
(36 cards)
Who was Florence nightingale?
She was a nurse and a pioneer in data visualization, who used her passion for statistics to save lives of soldiers during the Crimean war (1853-56).
What did Florence nightingale do?
She presented the death toll in a reveloutionary way,using colours to show, the distrubtions of death from different reasons, leading to urgent change and improvement in healthcare.
What is a census?
Is a way to find and record information about every member of a population, not a SAMPLE.
What are the 2 types of variables?
Catogerical and Numerical variables
What is a catogerical variable?
Qualititative data no numbers involved
What is Catogerial data split into?
Ordinal ( Catogeries with implied order e.g. ranking of unis) and Nominal ( Named catogeries e.g. country of origin)
What is a Numerical variable?
Quanitiative variables
What are Numerical data split into?
Continous (any numerical value e.g. weight) and discrete data ( only particular numbers e.g. eggs in a basket)
Catogrise these types of graphs as either catogerical or Numerical variables
Histogram
Bar chart
Scatter plot
Time series
Pie chart
Ogive
Bar chart ( Catogerial)
Pie chart (Catogerial)
Numerical
Histogram
Ogive
Time series
Scatter plot
Catogrise these
Gender of the respondent
household income
life satisfaction rating on 10 point scale
( catogerial variable, nominal)
( numerical variable, continous)
( catogerial variable, ordinal)
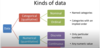
What is a nice diagram to show the difference between a Catogerial variable and a Numerical variable and its sub scripts.
When drawing a frequency table what are the 4 coloums it consists of?
Classes, frequency, percentage frequency and CF
Find the percentage frequency and culumative frequency?


For frequency tables lets say we have 10
The lower limit is included but the upper limit is not.
Do Bar chart, bars touch each other?
No
What is an ogive?
Ogive is a culumative frequency curve.

For a frequency table if the classes are not overlapping,then what data do we need?
Frequency and Percentage frequency.
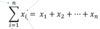
What is the notation of summation that we use in stats?
The top of the symbol signifies the end
The bottom of symbol signifies the start

What does this mean?

It means add everthing from 1 to n
X1 = 8 X2 = 2 X3 = -5 X4= 0.3 X5 = 9 X6 = 0 X7 = -3 X8 = 4 X9 = 10
Calculate the following


What is the notation of the mean?

How do you calculate mean of a frequency table?
Midpoint X Frequency, add them together then divide by n

Calculate the mean


What is a big disadvantage of the mean?
It is affected by outliers


