Measures of dispersion Flashcards
(28 cards)
Describe the red, blue and black line

Red- low variability ( condensed around the mean)
Blue - medium variability
Green - high variability ( the data is spread out around the mean)
What does variance measure?
How spread out a set of numbers are from the mean.
How do we calculate sample variance?
1) Find the mean of the dataset
2) Find the difference of each observation from the mean
3) Take the square differences of each difference
4) Add up all squared differences
5) Divide by n-1
How can we show sample variance is notation form?

Calculate sample variance


Whats another way to calculate sample variance?


How do we find sample variance of a frequency table?
1) Calculate the mean ( summation of midpoint x frequncy divide by n)
2) find square differences which is ( midpoint - mean)^2
3) Multiply square differences by corresponding frequency
4) Add up the mutiple of square differences and corresponding frequency
5) divide by n-1
What is the notation of variance for a frequency table?

Calculate mean, sample variance and SD?


What is a disdvantage of sample variance?
Different units of measurement
What methods solves the problem of different units of measurement and how do we work it out?
Standard deviation and its the square root of the variance.
What does standard deviation mean?
Measures how spreaded out the data is from the mean.
If a question says find 1,2 and 3 standard deviations from the mean how do we do this?


What is range and what is a disadvantage of it?
Max - Min and its affected by outliers
What is the Interquartile range?
Interquartile range measures variability by dividing the data into quartiles/quarters.

Lets say n =10
62 63 64 64 70 72 76 77 81 81
Find IQR

If sample size is odd,= 9
63 64 64 70 72 76 77 81 81
What is the IQR

What do histograms allow us to do?
Histograms help us visualise the centre and variability in a data set
Which histogram would have the biggest SD?
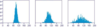
The last one
What are the 5 things a box plot must always contain?
Minimum value, lower quartile, median, upper quartile and maxmium value.
What does the whiskers of the box plot extend too?
The whiskers extend on either side of the box to: 1.5 x IQR the minimum value that is within of the lower quartile, 1.5 X IQR the maximum value that is within of the upper quartile.
All data outside the whiskers are outliers, represented by points.

Construct a box plot


