Time_series Flashcards
(42 cards)
Describe briefly the time line for a business time series project
What are possible pitfalls when using common metrics to evaluate time-series data?
One can be non stationarity and exploiting autocorrelation . It is very easy to get close to the right time series by simply shifting the values. It is way harder to predict the difference between values more than the actual values.
This are usually called persistence model. Simple autocorrelation plot can highlight this.
What is the ARIMA formula? explain it.

What is BIC?
It is very very similar to AIC
The Bayesian Information Criterion (BIC) is defined as
k log(n)- 2log(L(θ̂)).
Here n is the sample size; the number of observations or number of data points you are working with. k is the number of parameters which your model estimates, and θ is the set of all parameters.
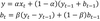
What is exponential smoothign model?
Exponential smoothing uses a similar logic to moving average, but this time, a different decreasing weight is assigned to each observations.
y = ax_t +(1-a)y_t-1
Here, alpha is a smoothing factor that takes values between 0 and 1. It determines how fast the weight decreases for previous observations.
Can we use regression instead of time series analysis for time series data?
Yes and they actually even perform better because we need to take into account a lot of exogenous factors which have impact on sales.
What cross-validation technique would you use on a time series data set.
Instead of using k-fold cross-validation, you should be aware to the fact that a time series is not randomly distributed data — It is inherently ordered by chronological order.
In case of time series data, you should use techniques like forward chaining — Where you will be model on past data then look at forward-facing data.
fold 1: training[1], test[2]
fold 1: training[1 2], test[3]
fold 1: training[1 2 3], test[4]
fold 1: training[1 2 3 4], test[5]
What is differencing and what is it used for ?
- Differencing : This is the commonly used technique to remove non-stationarity. Here we try to model the differences of the terms and not the actual term. For instance,
x(t) – x(t-1) = ARMA (p , q)
This differencing is called as the Integration part in AR(I)MA. Now, we have three parameters
p : AR
d : I
q : MA
Was it shown that modern statistical method like RNN deep NN or LSTM perform better than classical methods?
Actually not. Several papers showed that complex method have not surpassed classical methods yet
What is autocorrelation?
Informally, autocorrelation is the similarity between observations as a function of the time lag between them.
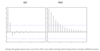
Is this an AM or AR model? What order should you use?
The blue line above shows significantly different values than zero. Clearly, the graph above has a cut off on PACF curve after 2nd lag which means this is mostly an AR(2) process
Do you have to re-train time series forecasting more often than traditional problems?
Yes. Because intrinsticaly the distribution the data are sampled from is changing. Its mean and variance change with time so differently from other problem you have tro retrain almost everytime you make a prediction
how would you increase accuracy of your model if the client needs it?
- Trying new models like NN LSTM regression etc and do bagging of them or stacking
- Ask for businees insight what data or market are important? Are there outliers? what can they be correlated with? Promotions ? big events?
- Explore more data
- have a clear and optimized loss funcion being carefull not to overfit
What is important when meeting a client for a new project?
Understand the data: what data are available what can be available? The maturity of a product to predict is very important
Time scale both on the project lenght and what time of forecast are needed. How far in time we need the prediction to be made?
What aspect should we focus on? sales stocks earnings?
Is it better to underforcast or over forecast?
How much variance can we tolerate? this will be related to the amount of time we have to develop the project?
For production: what is the scale of data? how quickly and how often do we need new forecast?
We can use business experience: what markets or external data are important in your experience? like regulations or stocks prices or weather etc
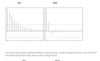
Think about an example ACF plot`
What is Vector autoregressiona and what is it used for?
The Vector Autoregression (VAR) method models the next step in each time series using an AR model. It is the generalization of AR to multiple parallel time series, e.g. multivariate time series.
The notation for the model involves specifying the order for the AR(p) model as parameters to a VAR function, e.g. VAR(p).
The method is suitable for multivariate time series without trend and seasonal components.
What are the classical steps to forecast a time series?

What important diagnose info can we get from residual’s model?
How can you stationarize a time series?
Detrending, you compute the trend with a model like logistic regression and then you remove it
Differencing remove a lagged version of the time series to the time series
What is a SARIMA model and what do the letters stands for?
SARIMA is actually the combination of simpler models to make a complex model that can model time series exhibiting non-stationary properties and seasonality.
S seasonality
AR autoregressive model
I integration order :The parameter d represents the number of differences required to make the series stationary.
MA Moving Average model
What is an autoregression model?
This is basically a regression of the time series onto itself. Here, we assume that the current value depends on its previous values with some lag. It takes a parameter p which represents the maximum lag. To find it, we look at the partial autocorrelation plot and identify the lag after which most lags are not significant.
Are AR or MA models applicable to non-stationary series?
you should remember, AR or MA are not applicable on non-stationary series.
In case you get a non stationary series, you first need to stationarize the series (by taking difference / transformation) and then choose from the available time series models.
What is peculiar about sales forecasting?
- • We need to have historical data for a long time period to capture seasonality. However, often we do not have historical data for a target variable, for example in case when a new product is launched. At the same time we have sales time series for a similar product and we can expect that our new product will have a similar sales pattern
- • Sales data can have a lot of outliers and missing data. We must clean outliers and interpolate data before using a time series approach.
- • We need to take into account a lot of exogenous factors which have impact on sales.