Supervised Learning Flashcards

1
Q

Model Evaluation Metrics - Which beta to use(high or low) - Fraud Detection

A

need a high recall, so need a high beta.

2
Q

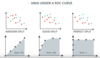
Model Evaluation Metrics - R2

A

comparing model MSE from basic model MSE. The idea is that the model MSE should be lower than basic model MSE. If so, the ratio is small and 1 - ratio is close to 1.

3
Q

Ensemble Methods - Introducing Randomness to high variance models before ensembling. Two common options

A

Bootstrap the data - that is, sampling the data with a replacement and fitting your algorithm to the sampled data.

Subset the features - in each split of a decision tree an ensemble of only a subset of the total possible features are used.

4
Q

Decision Tree - Entropy - How to turn a bunch of products into sums? To make the probability calculate more manageable.

A

Take the log of each item and sum everything together

5
Q

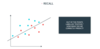
Support Vector Machines - Which equation will help us split the data?

A

The function that splits the data will be x2 + y2 = 10 (10 being in the middle of 2 and 18)

6
Q

Decision Trees - Entropy - Confirm how to calculate probabilities of recreating ball sequence

A

Since you grab the ball, and put it back each time, these are independent events and probabilities are multiplied by each other. *blue on first row should be zero

7
Q

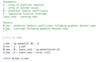
PyTorch - Batch Size?

Download and load the training data
trainset = datasets.MNIST(‘MNIST_data/’, download=True, train=True, transform=transform)
trainloader = torch.utils.data.DataLoader(trainset, batch_size=64, shuffle=True)

A

Each run through the network will use 64 images, then matrix where first column is a flattened vector version of one image

8
Q

Ensemble Methods - Adaboost hyperparameters

A

base_estimator: The model utilized for the weak learners (Warning: Don’t forget to import the model that you decide to use for the weak learner).

n_estimators: The maximum number of weak learners used.

9
Q

Bayes Theorem - Naive Bayes Fip Step. Use example below

A

Flip the event and conditional.

P(A | B) becomes P(B|A) * P(A). Think in terms of a diagram.

10
Q

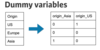
What is feature scaling, two common scalings?

A

transforming your data into a common range of values. There are two common scalings:

Standardizing

Normalizing

Allows faster converenge, training less sensitive to the scale of features

11
Q

Support Vector Machines - Describe C Parameter

A
  • C hyper-parameter determines how flexible we are willing to be with the points that fall on the wrong side of our dividing boundary
  • Constant that attaches itself to classification error
  • Large C = forcing your boundary to have fewer errors than when it is a small value. If too large, may not get converence with small error allotment
  • Small C = Focus on large margin
12
Q

Ensemble Methods - Explain Bias

A

When a model has high bias, this means that means it doesn’t do a good job of bending to the data. An example of an algorithm that usually has high bias is linear regression. Even with completely different datasets, we end up with the same line fit to the data. When models have high bias, this is bad.

13
Q

Linear Regression - Describe the Square Trick

A

Its the absolute trick and some. Multiply the distance of the point from the line against the scaled slope and y-intercept. More smart as it gives the line a smarter distance to change to get closer to the point.

14
Q
A

make a prediction, calculate the error, update weights and bias with gradient of error(scaled by learning rate)

15
Q

Linear Regression - Describe the absolute trick

A

Adding values to the slope and y intercept to make the line come closer to points. The value added to the slope should be the horizontal distance(p) and the value added to the y-intercept is arbitrary, but typically use 1. Then, must down scale these added values by a learning rate so the line doesn’t overshoot the point.

16
Q

Support Vector Machines - Describe Margin Error

A

norm of the vector W squared. AKA, square all coefficients and sum. You want a small error as this indicates a larger margin.

17
Q

Support Vector Machines - Describe the Kernel Trick

A

Transforming data from lower dimensions to higher dimensions in order to split with higher dimensional hyperplane. Then, project back to lower dimensional world with polynomial of certain degree.

18
Q

Describe Lasso Regularization

A

Allows for feature selection

Formula squishes certain coefficients to zero, while non zero coefficients inidcate relevancy

use an alpha(lambda) multiplied by sum of the absolute value of each coefficient. Adds this to error

19
Q

Ensemble Method - Boosting Simple Example

A

Instead of just taking most common answer, use answers from friends who are well versed in each question. Use answer from philospher friend for philosohy question, use answer from sports friend for sports question etc

20
Q

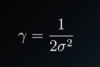
Support Vector Machines - Define gamma in terms of sigma

A

If gamma is large, the sigma is small(curve is narrow). Vice Versa

21
Q

Ensemble Methods - Basic idea of Random Forest

A

Take Subset of data and build decision tree of these columns. Repeat process with other random subset, then use most popular prediction as the prediction

22
Q

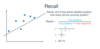
Model Evaluation Metrics - What is recall

A
23
Q

Ensemble Methods - High level what are they and name two popular options

A

Take a bunch of models and join together to get a better model

Bagging(Bootstrap aggregating) and Boosting

24
Q

Bayes Theorem - Naive Bayes - Normalize Step

A

Take conditional probabilities for all events(Spam and Ham), then normalize the values. (each probabilty over the sum of possible probabilities)

25
Q

Preprocessing - What to do in this scenario

A

Subtle, but you only need two columns since there are only 3 possibilities. If you include all three, you are duplicating data and certain models may have trouble

26
Q

Decision Trees - Describe Entropy

A

How much freedom do you have to move around

27
Q

PyTorch - What does the transform function do?

transform = transforms.Compose([transforms.ToTensor(),
transforms.Normalize((0.5, 0.5, 0.5), (0.5, 0.5, 0.5)),
])

A

first transform images to tensors,

then convert pixel values from 0-1 range to a -1 to 1 range

You are subtracting the mean(0.5) from each color channel(3), then dividing (0.5) from each color channel.

Ensures variance is zero centered which makes learning easier

28
Q

Ensemble Methods - Bagging Simple example

A

Have all our friends take a true/false test and for each question use the most common answer

29
Q

Describe Gradient Descent

A

Take the derivative of an error function and move in the negative direction. The negative direction gives us the fast way to decrease the error function

30
Q

Support Vector Machines - Describe Margin and Classification Error

A

When linearly separating data, Margins maximize the distance from the linear boundary to the closest points (called the support vectors).

Incorrectly classifed points within the Margin is the Margin Error

Any errors outside the margin are considered classification errors.

31
Q

Training and Tuning - K Fold Cross Validation Shuffle

A

Instead of equal splits, randomly creating different training and testing buckets K times

32
Q

Model Evaluation Metrics - Quiz

A
33
Q

Model Evaluation Metrics - ROC- What does score rerpresent

A

Area under ROC.

34
Q

Support Vector Machines - Where would SVM make cuts?

A

two lines to maximize margin

35
Q

Model Evaluation Metrics - F1 score

A

The harmonic mean of recall and precision

Will always be lower than arithmetic mean, so which ever score is lower, it will be closer to that, and thus raise a “red flag”

36
Q

Support Vector Machines - Describe Classification Error

A
  • Split data with line that represents Mx + b = 0,
  • Add margin lines = Mx + b = -1, Mx + b = 1
  • From Margin lines, create lines going up and down.
  • Find incorrectly classified points inside and out margins,
  • Associate a value based on point location, add all together
37
Q

Ensemble Methods - Downside of Random Forests

A

They are random, there are better ways to choose which data to subset

38
Q

Linear Regression - What variables can you change to move a line

A

Slope and Y intercept

39
Q

Model Evaluation Metrics - Create an Accuracy Function

A
40
Q

Support Vector Machines -What is it and name three popular versions?

A

popular algorithm used for classification problems

  1. Maximum Margin Classifier
  2. Classification with Inseparable Classes
  3. Kernel Methods
41
Q

Model Evaluation Metrics - When Accuracy is not good

A

If your accuracy is high, but your not detecting errors. Can occur when data is skewed with high number of positive versus low number of errors

42
Q

Decision Trees - Entropy - How to calculate probability of independent events if there are 5,000. Whats the downside?

A

Multiply each event, computationally expensive, small changes in one value can lead to large changes in outcome.

We want something more manageable

43
Q

Bayes Theorem - Discuss Naive Bayes

A

Involves multiple events and assumes independence

For P(A & B), we assume events are independent. If they were depependent, they couldn’t occur together.

Think P(being HOT & Cold). This can’t happen, however, Naive says they can.

Just multiplying all events together, multiplying by the “given” and normalizing ratio.

44
Q

Support Vector Machines - Gamma Parameter

A

Small = wide RBF, may underfit, may generalize better

Large = narrow RBF, may overfit. Similiar to Large C in classificaiton where it attempts to classify every point correctly

45
Q

two categories of supervised learning

A
46
Q

Training & Tuning - Describe Model Complexity Graph

A

One one end, your model underfits the data(high bias and doesn’t do well on either training or validation)

On other end, your model overfits(high variance, too complex, fits training data well but doesn’t generalize well

In middle, your model does pretty good on training and validation. Look for models where validation error is increasing but training error is reducing.

47
Q

Ensemble Methods - What are common default weak learners

A

Decision Trees

48
Q

What is normalizing?

A

data are scaled between 0 and 1

Value - min/ max-min

49
Q

Decision Tree - Entropy - Simplified Entropy Equation

A

probabilty * log of probability

sum across and take negative value.

50
Q

Ensemble Methods - Bagging Describe in more detailed

A

Take random cuts of data(weake learners), then superimpose over each other and vote(if two or more are red then red, two or more are blue, then blue)

Model will cut data according to votes

51
Q

Visualize Mean Absolute Error

A
52
Q

Model Evaluation Metrics - Purpose behind an ROC curve

A

provide a score that shows how well we split the data. 1 for perfect, .5 for random and above .5 for anything else

53
Q

Ensemble Methods - Adaboost weighting

A
  • weight all data points at 1
  • minimize sum of weights of incorrectly classified points
  • After first cut, calculate weight by taking natural log of correct/incorrect
  • multiply incorrect weights by the weight
  • Repeat
54
Q

What type of gradient descent is used most often

A

Mini - Batching - Split data into mini batches of equal size, update weights based on each mini batch

Calculating error for ALL points(either by batch or one by one(stochastic) is slow

55
Q

Training and Tuning - Learning Curves

A

Method of detecting if model is overfitting or underfitting. As more data points are used, training error increases and CV error descreases. Look at convergence point to determine if model is overfitting or underfitting

56
Q

Bayes Theorem - High Level Description

A

Involves a Prior and Posterior Probability. Use new information to update prior, this becomes the posterior.

57
Q

Decision Trees - Entropy described by probability

A

How much freedom do you have to move around or rearrange the balls

58
Q

Ensemble Methods - Explain Variance

A

When a model has high variance, this means that it changes drastically to meet the needs of every point in our dataset. Linear models like the one above is low variance, but high bias.

A decision tree, as a high variance algorithm, will attempt to split every point into it’s own branch if possible. This is a trait of high variance, low bias algorithms - they are extremely flexible to fit exactly whatever data they see.

59
Q

Ensemble Methods - Adaboost high level

A
  1. Split data to minimize errors
  2. punish misclassified points and use a weak learner to focus on these points. Fit this line
  3. Repeat step 2 for first weak learner
  4. Combine and fit
60
Q

Ensemble Methods - Combining Weights

A

Superimpose all weak learner models

For each weak learner model, input the positive and negative weight value accordingly. Where sum for each region is positive, then classify positive, where negative, classify negative

61
Q

Support Vector Machines - Where would SVM split and how?

A

Use kernel trick to move from 1-D line to 2-D(Plane) where points are placed on a parabola instead of a line. Find line that cuts the parabola cleanly, equate the line to the parabola and solve. These is where SVM makes cuts.

62
Q

Support Vector Machines - RBF(Radial Basis Function)

A
  • using functions to build mountains over each point
  • record values in a vector of all mountains over each point.
  • plug them into higher dimensional space
  • find equation of hyperplane that splits data
  • Take constants of the equation of the plane
  • plug points at these constants and find line that splits dat (Where hyperplane intersects mountains)
63
Q

Model Evaluation Metrics = What is precision of this model

A
64
Q

What is standardizing

A

Taking each value of your column, subtracting the mean of the column, and then dividing by the standard deviation of the column.

interpreted as the number of standard deviations the original value was from the mean.

65
Q

Training and Tuning - K-Fold Cross Validation

A

Split data into Training and Testing K Times. Each pass the bucket of training and testing is different. Take average result for all runs

66
Q

Support Vector Machines - Describe the degree of the polynomial kernel. Describe a degree 3 polynomial kernel

A

A hyperparameter we use during training to find best possible model

67
Q

Support Vector Machines - What is a kernel? Describe different kernels

A

Set of functions that will come to help us out.

Linear Kernal - can only use x and y to create a line which separates data

Polynomial Kernel - Add, xy x2 and y2. Can create many more functions to separate data

RBF Kernel - Build mountains over each point

68
Q

PyTorch - Describe the dimension in the F.softmax function

def forward(self, x):
 ''' Forward pass through the network, returns the output logits '''

x = self.fc1(x)
x = F.relu(x)
x = self.fc2(x)
x = F.relu(x)
x = self.fc3(x)
x = F.softmax(x, dim=1)

A

asks which dimension of the tensor

dim 0 - the batch size

dim 1 - vector of images. This is the dim we want

69
Q

Decision Trees - Hyperparmaters - Describe Maximum Depth

A

largest length between the root to a leaf. A tree of maximum length kk can have at most 2k2k leaves.

70
Q

Model Evaluation Metrics - Discuss Boundaries of Beta and impact on precision and recall

A
71
Q

Log Transformation - Provide example

A
72
Q

Model Evaluation Metrics - How is ROC calaculated

A

Calculate True Positive and False Positive Rates for all splits of data. Then plot

73
Q
A

must drop the point values into the equation to determine q prime

74
Q

Support Vector Machines - What does Sigma relate to in a normal distribution

A

The width of the mountain/curve

75
Q

Model Evaluation Metrics - F-beta score

A

Used when you want your model to care more about either precision or recall.

Its a weight added to the F1 score to swing the value either way

76
Q

3 main categories of machine learning

A
77
Q

Decision Trees - Entropy - Once you have the sum of the negative logs, what is the next step

A

Take the average

78
Q

Support Vector Machines - Margin Error - Describe W Vector

A
  • Used in distance calculation between two lines
  • Random vector that runs from orgin and intersects second line
  • Based on intersection points(p,q) and the equation of the line the vector intersects (Wx = 1), the 1/|W| square represents the distance from Wx = 0 to Wx = 1. Multiply by 2 since lines are equidistant and 2/|W| squared represents the Margin Error.
79
Q

Model Evaluation Metrics - Type 1 and 2 errors

A
80
Q

Decision Trees - Entropy - Why take the negative log of each probability event

A

Since probabilities are less than 1, the log will be negative. Thus, to turn the values to positive, we take the negative log

81
Q

Decision Trees - Hyperparameters - Describe minimum number of samples per leaf

A
82
Q

Decision Trees - Hyperparameters - Maximum Features and Minimum Number of samples per split

A

min num on split - gotta have at least x amount before you can split

Maximum Features -

83
Q

Two specific cases to use feature scaling

A
  • When your algorithm uses a distance based metric to predict.
    • If you don’t, then predictions will be misleading
  • When you incorporate regularization.
    • if you don’t, then you unfairly punsih features with smaller or larger ranges
84
Q

Ensemble Methods - Weak versus Strong Learners

A

Weak learners = our friends who take test

Strong Learner = Genius who combins all answers

85
Q

Two common error functions in linear regression

A

Mean Absolute Error - Make all errors positive so the negatives don’t cancel each other out.

Mean Squared Error - Take all errors and square them to make them non-negative. This gives you the area of a sqaure around each point. Sum and Average than multiply by 1/2 to facilitate taking derivative

86
Q

Support Vector Machines - Describe the x2 + y2 = 10 in single and multiple dimensions

A
87
Q

Model Evaluation Metrics - Precision

A

Accuracy of Diagnosed Positive Group

88
Q

Describe Supervised Learning

A

observing and associating patterns of labeled data, take this training and assingn labels to new and unlabeled data.

89
Q

Model Evaluation Metrics - Recall

A

Accuracy of Positive Group

90
Q

Decision Trees - Entropy describe by knowledge

A

Less entropy = less room to move around = more knowledge you have

91
Q

Model Evaluation Metrics - Describe a confusion matrix

A

Rows = Positive versus negative

Columns = Guessed Positive, Guessed Negative

92
Q

Decision Trees - Information Gain - How to calculate?

A
  • Change in Entropy between part node and children node
  • Parent Entropy is always 1
  • Take weighted average of the children
93
Q

Bayes Theorem - Known versus Inferred?

A

Known

You know a P(A) and you know P(R | A)

Inferred

Once we know the event R has occurred, we infer P(A | R)

Find conditional probability of event and divide into possible events that have occurred.

94
Q
A

Since the point is below the line, the intercept decreases; since the point has a negative x-value, the slope increases.

If point was above line, then you would add the alpha and p*alpha

95
Q

Decision Trees - Hyperparameters - Impact on overfitting/underfitting for small/large samples per leaf and small large depth

A

Large depth very often causes overfitting, since a tree that is too deep, can memorize the data. Small depth can result in a very simple model, which may cause underfitting.

Small minimum samples per leaf may result in leaves with very few samples, which results in the model memorizing the data, or in other words, overfitting. Large minimum samples may result in the tree not having enough flexibility to get built, and may result in underfitting.

96
Q

Explain Batch vs Stochastic Gradient Decent

A

Batch - Calculate error for all points, then update weights

Stochastic - calculate error for one point, then update weights

97
Q

Bayes Theorem - Naive Bayes - Be Naive Step

A

Split into a product of simple factors. Then, multiply by Prob of Event

Do this for all possible events (Spam & Ham)

98
Q

Vizualize Mean Squared Error

A
99
Q

Decision Trees - Entropy - Formula - Describe the formal notation

A
  1. find prob of each event
  2. take negative log
  3. multiple by occurences of event
  4. Take average
  5. Repeat for each probability
  6. Sum
100
Q

Negative Indexing - What is the difference between the following:

X = data[: , :-1]
y = data[: , -1]

A

X will grab all rows and all columns except the last

Y will grab all rows and just the last column

101
Q

Log-Transformation of Skewed Data - Why do it?

A

so very large and very small values do not negatively affect the performance of a learning algorithm. Using a logarithmic transformation significantly reduces the range of values caused by outliers. Care must be taken when applying this transformation however: The logarithm of 0 is undefined, so we must translate the values by a small amount above 0 to apply the the logarithm successfully.

102
Q

Support Vector Machines - Describe the photo below in relation to gamma

A

Large Gamma = trying to classify every point

Small Gamma = Clusters