Stats Flashcards
(221 cards)
What are the two kinds of statistics in respect to their use?
1) Descriptive statistics: Measures of central tendency and variability
2) Inferential statistics: Parameter estimation, defining uncertainty, determining reasons for variation.
Bias
Any systematic deviation between sample estimates and a true value
Inference
Drawing a conclusion from a premise.
Premise
A premise is a statement we assume is true (e.g. data and observations).
The two kinds of variability in a study
1) Variability related to the variables we’re investigating.
2) Variability that is not interesting in the context of what we are investigating (noise variability).
What is the purpose of inferential statistics?
1) To discriminate between interesting variation and noise variation.
2) To determine the probability of observing such variability if a scientific mechanism was not operating.
What is an informal way think of “statistically significant” as?
Statistically significant = unlikely to hve ocurred by chance.
How does statistical analysis fit into the scientific method?
Statistical analysis allows for an objctive assessment of evidence in support or against a hypothesis.
What is a scientific hypothesis?
A scientific hypothesis is a proposed cause and effect relationship between a process and an observation.
Observation = what
Hypothesis = how
What is a statiscial hypothesis?
Simply a statment about whether there is or not a pattern of interest in the data.
What are the two types of statistical hypotheses?
- H0* (null hypothesis) = No effect on predictor variable
- HA* (alternative hypothesis) = Effect on predictor variable
What are the two kinds of variables in an experiment?
1) Predictor variable (aka independent variable)
2) Response variable (aka dependent variable)
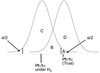
What is µ0 “mew not” in a one-sample study?
µ0 is the true population mean.
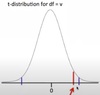
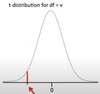
What is α?
α is a set proability criterion we use to reject a null hypothesis. It’s a set chance for incorreclty rejecting a null hypothesis.
In testing a hypothesis, what is a sample used for?
In testing a hypothesis, we use a sample to estimate characteristics of an underlying population.
The statement “We calculate the proability H0 is true, given the data” is wrong.
1) Why is this?
2) What is the correct statment?
1) Population paremeters are fixed, so either H0 is true or not.
2) The correct statment would be “We calculate the probability of oberving the data we gathered given a H0”.
How are the N0 and NA formualted in a one-sample test?
- H0*: µ = µ0
- HA*: µ ≠ µ0
OR
- H0*: µ - µ0 = 0
- HA*: µ - µ0 ≠ 0
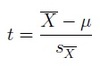
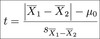
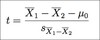
To test a hypothesis we use a test statistic. Broadly, how is a test statistic calculated?
Test statistic = effect (i.e. µ - µ0) / error
How is a test statistic used for testing a hypothesis?
1) Either comparing the test statistic to a critical value
or
2) calculating a p-value associated with that test statistic
How is a p-value interpreted?
The p-value can e though of as the probability of observing the data if the H0 was true.
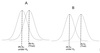
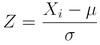
In the example of a z statistic, what is z?

z is the number of stander deviations by which the observed mean differs from the population mean.
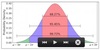
What does the central limit theorem state?
The CLT states that the distribution of means from a non-normal populaion will not be normal but will approximate normalityas n increases.
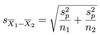
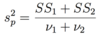
How is population variance calculated?
How is sample variance calculated?