(cardioresp) electrocardiography & rhythm disorders Flashcards

1
Q

what is the clinical relevance of the ECG?

A

helps to identify conduction abnormalities, structural abnormalities and perfusion abnormalities

2
Q

what are the advantages of ECGs?

A

relatively cheap and easy to undertake

reproducible between people and centres and over time

quick turnaround on results and reports

3
Q

what are the components to an ECG?

A

electrodes (stick onto skin directly)

cables/wires (connect to electrodes)

leads (results - representation of electrical activity from a specific perspective)

4
Q

what are the electrodes in an ECG?

A

small, conductive patches that stick to the skin and are placed at certain spots on the limbs to record electrical activity

5
Q

what are the leads in an ECG?

A

an ECG lead is a graphical representation of the heart’s electrical activity which is calculated by analysing data from several ECG electrodes.

6
Q

what are the cables/wires in an ECG?

A

cables/wires connect the electrodes on the skin surface to the ECG machine

7
Q

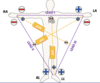
how many electrodes, cables and leads are present in an ECG?

A

10 electrodes
10 cables/wires
12 leads

8
Q

why is an ECG important?

A

used to record the electrical activity of the heart from different angles to both identify and locate pathology

9
Q

what is a vector?

A

a quantity that has both magnitude and direction

typically represented by an arrow in the net direction of movement, whose size reflected the magnitude of the vector

10
Q

how is a vector respresented?

A

typically represented by an arrow in the net direction of movement, whose size reflected the magnitude of the vector

11
Q

which electrode are upward deflections towards?

A

positive electrode

12
Q

which electrode are downward deflections towards?

A

negative electrode

13
Q

what does the steepness of the vector line denote?

A

the velocity of the action potential

14
Q

what does the width of the vector line denote?

A

the duration of the event

15
Q

what does an isoelectric line represent?

A

no net change in voltage = no depolarisation occuring

16
Q

what does an isoelectric line look like?

A

vectors are perpendicular to the lead

17
Q

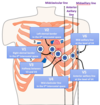
describe the electrical conduction pathway within the heart

A

sinoatrial node

(via internodal tracts)

atrioventricular node

(via bundle of His)

branched bundles (i.e left and right bundle branches)

Purkinje fibres

18
Q

when does the line deflect downwards on an ECG?

A

wave of depolarisation moving towards –ve from +ve

19
Q

when does the line deflect upwards on an ECG?

A

wave of depolarisation moving towards +ve from -ve

20
Q

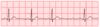
what are the letter components of an ECG?

A

P, Q, R, S and T

21
Q

what is a P wave?

A

the electrical signal that stimulates atrial depolarisation, preceding contraction of the atria (atrial systole) = a few milliseconds apart

22
Q

what is the QRS complex?

A

the electrical signal that stimulates ventricular depolarisation, preceding contraction of the ventricles (ventricular systole) = a few milliseconds apart
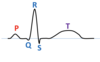
23
Q

what is a T wave?

A

the electrical signal that stimulates ventricular repolarisation, preceding relaxation of the ventricles (ventricular diastole) = a few milliseconds apart

24
Q

what does the QRS complex precede?

A

ventricular contraction = occurs a few milliseconds after

25
how is atrial systole shown on an ECG?
P wave
26
how is ventricular systole systole shown on an ECG?
QRS complex
27
how is ventricular diastole shown on an ECG?
T wave
28
when does the electrical activity occur in comparison to the mechanical contraction?
electrical activity precedes the myocardial contraction (mechanical activity) = a few milliseconds apart
29
what is the function of the sinoatrial node?
stimulates atrial depolarisation
30
what does the sinoatrial node consist of?
autorhythmic myocytes
31
what are autorhythmic myocytes?
self‐excitable cells that are able to generate an action potential without external stimulation by nerve cells e.g. SAN, AVN, Purkinje fibres
32
what is the function of the atrioventricular node and why is this important?
'electrical gatekeeper; between the atria and ventricles' to delay the conduction of the wave of depolarisation from the SAN = delay allowing for proper atrial contraction AND efficient ventricular filling
33
what is the sinoatrial node linked to on an ECG?
P wave
34
what is the atrioventricular node linked to on an ECG?
isoelectric on an ECG (as no depolarisation BUT slows down the conduction of the wave of depolarisation) = allow sufficient time for complete atrial contraction AND efficient ventricular filling
35
how does the speed of conduction change from the SAN to the AVN?
slower signal transduction than at SAN = delay introduced allows sufficient time for ventricular filling
36
how does the speed of conduction change from the AVN to the Bundle of His?
goes back to rapid conduction (more rapid than SAN)
37
how is the Bundle of His adapted for rapid conduction?
insulated
38
what are the bundle branches responsible for?
septal depolarisation
39
what are the Purkinje fibres responsible for?
ventricular depolarisation
40
what part of an ECG are Purkinje fibres linked to?
QRS complex
41
what do fully depolarised ventricles look like on an ECG?
isoelectric on an ECG
42
what does ventricular repolarisation look like on an ECG?
T wave
43
explain why there is a dip from the isoelectric line to point Q during septal depolarisation
septal depolarisation occurs from left-to-right depolarisation of the interventricular septum = opposite to the direction of the electrode (BUT only minor negative deflection)
44
what are the three types of leads in ECG?
chest leads (unipolar) limb leads (bipolar) augmented limb leads (unipolar)
45
list the leads that make up a 12-lead ECG
unipolar chest leads V1 V2 V3 V4 V5 V6 unipolar augmented limb leads aVR aVL aVF bipolar limb leads lead I lead II lead III
46
name the bipolar leads and describe their placement
bipolar limb leads lead I = right arm to left arm lead II = right arm to left leg lead III = left arm to left leg (rule of Ls)
47
name the chest leads and describe their placement
unipolar chest leads ``` V1 = 4th ICS, right sternal border V2 = 4th ICS, left sternal border V3 = halfway between V2 and V4 V4 = 5th ICS, mid-clavicular line V5 = 5th ICS, anterior axillary line V6 = 5th ICS, mid-axillary line ```
48
name the augmented leads and describe their placement
unipolar augmented limb leads aVR (augmented Vector Right) = +ve electrode on right shoulder aVL (augmented Vector Left) = +ve electrode on left shoulder aVF (augmented Vector Foot) = +ve electrode on (left) foot
49
name the unipolar leads and explain why they are called so
- unipolar chest leads: V1-V6 - unipolar augmented leads: avf, aVR, aVL called unipolar because they only assess the signal at one electrode
50
name the bipolar leads and explain why they are called so
- bipolar limb leads: lead I-III called bipolar because they compare the signals at two electrodes
51
where is V1 placed and what colour is associated with it most commonly?
4th ICS, right sternal border red
52
where is V2 placed and what colour is associated with it most commonly?
4th ICS, left sternal border yellow
53
where is V3 placed and what colour is associated with it most commonly?
5th ICS, between V2 and V4 green
54
where is V4 placed and what colour is associated with it most commonly?
5th ICS, mid-clavicular line brown
55
where is V5 placed and what colour is associated with it most commonly?
5th ICS, anterior axillary line black
56
where is V6 placed and what colour is associated with it most commonly?
5th ICS, mid-axillary line purple
57
where is RA placed and what colour is associated with it most commonly?
either on the right shoulder or right wrist (wrist/shoulder consistent w left side) red
58
where is LA placed and what colour is associated with it most commonly?
either on the left shoulder or left wrist (wrist/shoulder consistent w right side) yellow
59
where is RL placed and what colour is associated with it most commonly?
either on the right thigh or right ankle (thigh/ankle consistent w left side tho) black
60
where is LL placed and what colour is associated with it most commonly?
either on the left thigh or left ankle (thigh/ankle consistent w right side tho) green
61
what information can you see on this ECG?
(should have patient info) bottom - date and time ECG taken - where it was done - rate of the paper = 25mm/sec (common) - amplitude/voltage = 10mm/mV each lead - labels of all twelve leads (all look at the heart in diff way/diff perspective = diff waves) upper - heart rate calculated - loads of intervals worked out - axis worked out - key voltages in diff leads
62
why is the normal, most common rate of ECG paper?
normally 25mm/second but can differ rarely (so must check!)
63
what must you remember about the limb leads when taking an ECG?
always pair wrist placement with ankle placement always pair shoulder placement with thigh placement (cannot do wrist and thigh - bit random :/ as well as shoulder and ankle)
64
what is the length of a small square on ECG paper? (x axis)
0.04 seconds = 40 milliseconds (!)
65
what is the length of a large square on ECG paper? (x axis)
0. 2 seconds (200 ms) (0. 04 x 5 = 0.2)
66
what is the height of a small square on ECG paper? (y axis)
0.1 mV
67
what is the height of a large square on ECG paper? (y axis)
0. 5 mV (0. 1 x5 = 0.5)
68
what are the ECG artery territories?
each of the leads of the ECG (barring aVR) are associated with a region of the heart and a specific coronary artery = tells us how effectively the cardiac muscle of that region is being perfused by that specific coronary artery
69
name the ECG artery territories
lateral inferior septal anterior
70
which leads are septal leads?
V1 V2 (associated with the LAD artery)
71
which leads are anterior leads?
V3 V4 (associated with the LAD)
72
which leads are lateral leads?
V5 V6 lead I avL (associated with the LCx artery)
73
which leads are inferior leads?
lead II lead III aVF (associated with the RCA)
74
which coronary artery are the septal leads associated with?
left anterior descending (LAD)
75
which coronary artery are the anterior leads associated with?
left anterior descending (LAD)
76
which coronary artery are the lateral leads associated with?
left circumflex artery (LCx)
77
which coronary artery are the inferior leads associated with?
right coronary artery (RCA)
78
what is the rhythm strip and why is it important?
to assess the cardiac rhythm accurately, a prolonged recording from one lead is used to provide a rhythm strip = lead II, which usually gives a good view of the P wave, is most commonly used to record the rhythm strip
79
how long are most leads time-wise on an ECG?
approx 2.5 seconds
80
how long is the rhythm strip time-wise on an ECG?
approx 10 seconds (usually of lead II)
81
which lead is most commonly used as the rhythm strip and why?
lead II - as it usually gives a good view of the P wave
82
what does ST elevation in leads II, III and aVF indicate?
obstruction of the RCA
83
summarise the - location (chest/limb) - polarity - plane (coronal/horizontal) - +ve electrode - view (S/A/L/I) - artery of each of the leads in a 12-lead ECG
84
how many milliseconds make a second?
100ms = 1 second (so 0.04s of a small ECG square 40ms)
85
name the intervals commonly calculated from an ECG
single wave calculations: P-R interval Q-T interval S-T interval adjacent wave calculations: R-R interval
86
name the durations commonly calculated from an ECG
P wave duration QRS complex duration T wave duration
87
differentiate between a P-R interval and a P-R segment
a P-R interval = time from the onset of the P wave to the start of the QRS complex a P-R segment = flat, usually isoelectric segment between end of the P wave and the start of the QRS complex
88
differentiate between an S-T interval and an S-T segment
an S-T interval = time from the end of the QRS complex to the end of the T wave an S-T segment = flat, usually isoelectric segment between end of the QRS complex and the start of the T wave
89
label the segments, intervals, and waves on the following ECG
90
how is heart rate calculated from an ECG?
method 1: 300/number of large squares method 2: 60,000/(40 x number of small squares)
91
what is the direction of lead I?
from the RA (-ve) to the LA (+ve)
92
what is the direction of lead II?
from the RA (-ve) to the LL (+ve)
93
what is the direction of lead III?
from LA (-ve) to the LL (+ve)
94
what is the direction of aVR?
from lead III (-ve) to the RA (+ve)
95
what is the direction of lead aVL?
from lead II (-ve) to the LA (+ve)
96
what is the direction of lead aVF?
from lead I (-ve) to the LL (+ve)
97
what is cardiac axis?
gives us an idea of the overall direction of electrical activity = average direction of ventricular depolarisation during ventricular contraction
98
how is the cardiac axis calculated using exact calculations?
99
how else can this cardiac axis be worked out?
100
what must you do before interpreting an ECG?
always verify voltage = 10mm/mV and paper speed = 25mm/s (!!! - very standardised but still)
101
what are the steps to analysing ECGs?
step 1 = rate & rhythm step 2 = P wave duration, P-R interval step 3 = QRS duration step 4 = QRS axis step 5 = S-T segment (step 6 = Q-T interval) (step 7 = T wave)
102
what is the normal QRS axis?
normal axis deviation = -30 ro 90 degrees
103
summarise how ECGs are reported
104
interpret the following ECG and explain your reasoning
sinus rhythm - each P wave is followed by a QRS complex (1:1) - rate is regular (even R-R intervals) and normal (83 bpm) - otherwise unremarkable
105
what are the characteristic features of sinus rhythm on an ECG?
- each P wave is followed by a QRS complex (1:1) - rate is regular (even R-R intervals) and normal - otherwise unremarkable
106
what is a normal heart rate?
60-100 bpm
107
interpret the following ECG and explain your reasoning
sinus bradycardia - each P wave is followed by a QRS complex (1:1) - rate is regular (even R-R intervals) and SLOW (56 bpm)
108
what are the characteristic features of sinus bradycardia on an ECG?
- each P wave is followed by a QRS complex (1:1) - rate is regular (even R-R intervals) and SLOW (56 bpm)
109
what can sinus bradycardia be caused by?
can be caused by medication or vagal stimulation = can be healthy, not always pathological!
110
interpret the following ECG and explain your reasoning
sinus tachycardia - each P wave is followed by a QRS complex (1:1) - rate is regular (even R-R intervals) and FAST (107 bpm)
111
what can sinus tachycardia be caused by?
most often a physiological response to something (i.e. secondary)
112
what are sinus waves and what are the 'types'?
normal rhythm waves = sinus rhythm, sinus bradycardia, sinus tachycardia !! each P wave is followed by a QRS complex (1:1) !!
113
interpret the following ECG and explain your reasoning
sinus arrhythmia - each P wave is followed by a QRS complex (1:1) - rate is IRREGULAR (variable R-R intervals) and normal-ish (65-100 bpm)
114
why are the R-R intervals so erratic in this ECG?
varies with breathing cycle = irregular breathing, irregular R-R intervals
115
what indicates a normal rate?
approx 60-100 bpm
116
what indicates normal rhythm?
even R-R intervals
117
what indicates irregular rhythm?
variable R-R intervals
118
what are the characteristic features of sinus tachycardia on an ECG?
- each P wave is followed by a QRS complex (1:1) - rate is regular (even R-R intervals) and FAST (107 bpm)
119
what are the characteristic features of sinus arrhythmia on an ECG?
- each P wave is followed by a QRS complex (1:1) - rate is IRREGULAR (variable R-R intervals) and normal-ish (65-100 bpm)
120
what usually slows down heart rate to within the expected interval?
vagal parasympathetic stimulation
121
interpret the following ECG and explain your reasoning
atrial fibrillation - oscillating baseline, not exactly flat and isoelectric (atria contracting asynchronously) - rhythm can be irregular and rate can be variable and slower than normal
122
why does the baseline oscillate in atrial fibrillation on an ECG?
the atria are contracting asynchronously (i.e. haphazardly) = turbulent flow = increases clot risk (so patient may be on warfarin)
123
what is the impact of the asynchronous contraction of the atria in atrial fibrillation?
results in turbulent flow = increased risk of clot formation
124
how is the increased risk of clot formation mitigated in atrial fibrillation?
patient likely to be prescribed warfarin
125
what are the characteristic features of atrial fibrillation on an ECG?
- oscillating baseline (as atria are contracting asynchronously) - rhythm may be irregular and rate may be slow
126
interpret the following ECG and explain your reasoning
atrial flutter - regular 'saw-tooth' pattern in baseline (lead II, lead III, aVF) - not always visible in all leads - atrial to ventricular beats are a 2:1, 3:1 ratio or higher
127
what are the characteristic features of atrial flutter on an ECG?
- regular 'saw-tooth' pattern in baseline (lead II, lead III, aVF) - not always visible in all leads - atrial to ventricular beats are a 2:1, 3:1 ratio or higher
128
where is the 'saw-tooth' pattern seen in an atrial flutter ECG?
usually seen in lead II, lead III and aVF (inferior leads) = not always seen in every lead (!!)
129
describe the ratio of atrial to ventricular contraction in atrial flutter on an ECG?
atrial to ventricular beats at a 2:1 ratio, 3:1 ratio, or higher
130
interpret the following ECG and explain your reasoning
first degree heart block - prolonged PR segment/interval caused by slower AVN conduction - regular rhythm - 1:1 ratio of P waves to QRS complexes
131
what are the characteristic features of first-degree heart block?
- prolonged PR segment/interval caused by slower AVN conduction - regular rhythm - 1:1 ratio of P waves to QRS complexes
132
how does first-degree heart block compare to other degrees of heart block?
most benign form of heart block usually a progressive disease of ageing
133
(briefly) explain the pathophysiology of first-degree heart block (link to features on an ECG)
- AVN takes longer to conduct signal = elongated P-R segment/interval - conduction system is functional = all P waves result in QRS complexes (1:1 ratio)
134
what are the two types of second-degree heart block?
Mobitz I Mobitz II
135
interpret the following ECG and explain your reasoning
second-degree heart block (mobitz I) - gradual prolongation of the PR interval until beat skipped - most P-waves are followed by QRS; but some P-waves are not - regularly irregular (caused by a diseaed AV node)
136
what are the characteristic features of second-degree heart block (Mobitz I)?
- gradual prolongation of the PR interval until beat skipped (QRS dropped) - most P-waves are followed by QRS; but some P-waves are not - regularly irregular (caused by a diseased AV node)
137
what is Mobitz I second-degree heart block also called?
Wenkebach's block
138
(briefly) explain the pathophysiology of second-degree heart block (Mobitz I) (link to features on an ECG)
varying failure of conduction through the diseased AVN occurs = some P waves may not be followed by a QRS complex (i.e. the 1:1 P:QRS ratio maintained in first-degree heart block no longer is)
139
interpret the following ECG and explain your reasoning
second degree heart block (Mobitz II) - regular P waves but only some are followed by QRS complexes - no P-R prolongation - regularly irregular: successes to failures (e.g. 2:1) or random
140
what are the characteristic features of second-degree heart block (Mobitz II)?
refers to periodic atrioventricular block with constant PR intervals in the conducted beats - regular P waves but only some are followed by QRS complexes - no P-R prolongation - regularly irregular: successes to failures (e.g. 2:1) or random
141
(briefly) explain the pathophysiology of second-degree heart block (Mobitz II) (link to features on an ECG)
the AVN becomes periodically blocked but when it is not, there are regular P waves and P-R intervals
142
what must you remember about all kinds of heart block?
can rapidly deteriorate into the next degree of heart block
143
differentiate between the two types of second-degree heart block
Mobitz I (Wenkebach) = gradual prolongation of the P-R interval until a subsequent QRS complex in dropped (conduction through the AVN does occur but can at times be impaired) Mobitz II = refers to periodic atrioventricular block with constant PR intervals in the conducted beats
144
what happens if second degree Mobitz II heart block is left untreated?
will rapidly progress onto third degree heart block
145
interpret the following ECG and explain your reasoning
third-degree heart block (complete) - all P-waves are regular, QRS complexes are regular, but no relationship - P waves can be hidden within bigger vectors - non-sinus rhythm (require back-up pacemaker cells = i.e. ventricle tries to compensate)
146
what are the characteristic features of third-degree heart block?
- all P-waves are regular, QRS complexes are regular, but no relationship - P waves can be hidden within bigger vectors - non-sinus rhythm (require back-up pacemaker cells = i.e. ventricle tries to compensate)
147
(briefly) explain the pathophysiology of third-degree heart block (link to features on an ECG)
the electrical signal from the atria to the ventricles is completely blocked = ventricle usually starts to beat on its own acting as a substitute pacemaker but the heartbeat is slower and often irregular and not reliable
148
third-degree heart block presents with a non-sinus rhythm - explain what this is and how this is overcome :)
abnormal rhythm of the heart where electrical stimuli are not always initiated properly in the SA node and may not follow the normal conduction pathway in the heart = the ventricular cells (blocked from atrial SAN communication will begin to act as their own pacemaker cells)
149
what is the implication of third-degree heart block?
as non-sinus rhythm occurs due to complete blockage between the atria and the ventricles = alternative cells need to act as pacemaker cells (in this case, ventricular myocytes)
150
differentiate between the pathophysiology of the three types of heart block
first-degree = conduction through the AVN is slowed and impaired but not stopped (i.e. conduction system is still intact) second-degree (Mobitz I) = conduction is slowed through the AVN node but can sometimes be completely stopped (but often returns to conduction) second-degree (Mobitz II) = periodic atrioventricular block with constant PR intervals in the conducted beats third-degree = complete block of the electrical signal from the atria to the ventricles
151
differentiate between the presentation of the three types of heart block on an ECG
first-degree = elongated P-R intervals second-degree (Mobitz I) = gradual elongation of P-R intervals until beat skipped second-degree (Mobitz II) = normal ECG except some P waves may not be followed by QRS complexes third-degree = regular P waves and regular QRS complexes but no relationship between the two
152
interpret the following ECG and explain your reasoning
ventricular tachycardia - P-waves hidden within QRS complexes so cannot see (dissociated atrial rhythm) - rate is regular & fast (100-200bpm)
153
what are the characteristic features of ventricular tachycardia?
- P-waves hidden within QRS complexes so cannot see (dissociated atrial rhythm) - rate is regular & fast (100-200bpm) (- even though rhythm is very fast, it is still functional)
154
what must you remember about ventricular tachycardia?
shockable rhythm (!!!!!!!) = defibrillators widely available if not acted on swiftly, can risk deterioration into ventricular fibrillation (cardiac arrest)
155
what does ventricular tachycardia risk if it is not addressed immediately?
- at high risk of deteriorating into fibrillation (cardiac arrest)
156
how do P waves appear in ventricular tachycardia?
hidden within the QRS complexes, not very pronounced/distinguishable
157
why must you shock a patient who has ventricular tachycardia?
v tach = poorly perfusing rhythm and patients may present with or without a pulse so to regulate rhythm and allow the SAN to overtake as the primary pacemaker cells
158
interpret the following ECG and explain your reasoning
ventricular fibrillation - heart rate irregular and 250 bpm and above - heart unable to generate an output - shockable rhythm – defibrillators widely available
159
what are the characteristic features of ventricular fibrillation?
- heart rate irregular and 250 bpm and above - heart unable to generate an output - shockable rhythm – defibrillators widely available
160
differentiate between ventricular tachycardia and ventricular fibrillation
tachycardia - still likely to have some cardiac output, but very fast rhythm that needs to be defibrillated back to normal - 100-200 bpm (regular) fibrillation - extremely fast rhythm so ventricular filling does not properly occur before contraction so no blood is being pumped out - above 250 bpm (irregular) (both are shockable rhythms!)
161
why can a cardiac output not be generated properly in ventricular fibrillation?
heart rate is very very fast and very irregular = no time for proper ventricular filling before the ventricles contract so sometimes, no blood is pumped out (!!!!!)
162
name the two shockable rhythms
ventricular tachycardia ventricular fibrillation
163
interpret the following ECG and explain your reasoning
ST elevation - P waves visible and always followed by QRS (1:1) - rhythm is regular and rate is normal (85 bpm) - ST-segment is elevated \>2mm above the isoelectric line
164
what are the characteristic features of ST elevation?
- P waves visible and always followed by QRS (1:1) - rhythm is regular and rate is normal (85 bpm) - ST-segment is elevated \>2mm above the isoelectric line
165
what is ST elevation?
when the ST-segment is elevated \>2mm above the isoelectric line
166
what causes ST elevation?
caused by infarction (tissue death caused by hypoperfusion) = infarcted myocardium leads to muscle death
167
interpret the following ECG and explain your reasoning
ST depression - P waves visible and always followed by QRS - rhythm is regular and rate is normal (95 bpm) - ST-segment is depressed \>2mm below the isoelectric line
168
what are the characteristic features of ST depression?
- P waves visible and always followed by QRS - rhythm is regular and rate is normal (95 bpm) - ST-segment is depressed \>2mm below the isoelectric line
169
what is ST depression?
when the ST-segment is depressed \>2mm below the isoelectric line
170
what causes ST depression?
caused by myocardial ischaemia (coronary insufficiency) = reduction in the oxygen supply causing slower damage
171
differentiate between ST elevation and ST depression
ECG - while ST elevation is when the ST segment is \>2 mm above the isoelectric line - ST depression is when the ST segment is \<2 mm below the isoelectric line pathophysiology - ST elevation is caused by myocardial infarction (muscular blood supply completely lost) - ST depression is caused by myocardial ischaemia (muscular blood supply significantly reduced, but not lost)
172
what is the key feature of atrial fibrillation on an ECG?
oscillating baseline (high risk of clots managed with oral anticoagulation)
173
what is the key feature of atrial flutter on an ECG?
sawtooth pattern often occurring in a 2:1 or 3:1 ratio of P to QRS
174
what is the key feature of first-degree heart block on an ECG?
PR interval longer than normal, due to slower conduction
175
what is the key feature of second-degree (Mobitz I) heart block on an ECG?
PR interval gradually elongates until a beat is missed
176
what is the key feature of second-degree (Mobitz II) heart block on an ECG?
P waves are regular, but some beats not conducted (e.g. 2:1 is two beats conducted then one missed)
177
what is the key feature of third-degree heart block on an ECG?
atria and ventricles beat asynchronously – HR at non-sinus rhythm
178
what is the key feature of ventricular tachycardia on an ECG?
very fast ventricular rate, can rapidly progress and needs defibrillation
179
what is the key feature of ventricular fibrillation on an ECG?
cardiac arrest; asynchronous ventricular contract, no output, needs defibrillation
180
what is the key feature of ST elevation and depression on an ECG?
\>2 mm baseline deviation up or down indicates infarction or ischaemia, respectively
181
what is cardiac arrest alternatively known as?
ventricular fibrillation
182
what does the following ECG show? explain your reasoning
second degree heart block (Mobitz II) = P-R interval elongates gradually until for one of the waves the QRS complex is dropped
183
what does the following ECG show? explain your reasoning
sinus rhythm = regular rate; regular rhythm + every P wave is followed by a QRS (1:1)
184
what does the following ECG show? explain your reasoning
ventricular tachycardia = P waves are hidden in the QRS complex; rate is regular & fast
185
what does the following ECG show? explain your reasoning
first-degree heart block = prolonged P-R interval (!!!) = regular rate and rhythm = P waves are followed by QRS complexes (1:1)
186
what does the following ECG show? explain your answer
sinus tachycardia = rate increased, rhythm regular = normal P:QRS ratio of 1:1
187
what does the following ECG show? explain your answer
ST depression = the ST segment is depressed \>2mm below the isoelectric line = regular rate and rhythm + normal P:QRS ratio
188
what does the following ECG show? explain your answer
atrial flutter = classic 'saw-tooth' baseline pattern (in II, III, avF) = atrial:ventricular beats are 2:1/3:1
189
what does the following ECG show? explain your answer
ventricular fibrillation = very irregular rate and rhythm
190
what does the following ECG show? explain your answer
sinus bradycardia = rate reduced, rhythm normal = normal P:QRS ratio
191
what does the following ECG show? explain your answer
third-degree (complete) heart block = regular P waves, regular QRS complexes but no relationship bw them (i.e. non-sinus rhythm)
192
what does the following ECG show? explain your answer
sinus arrhythmia = normal P:QRS complex ratio BUR rate is very irregular, yet usually normal
193
what does the following ECG show? explain your answer
ST-elevation = normal P:QRS, normal rate and rhythm = BUT the ST segment is elevated \>2mm above the isoelectric line
194
what does the following ECG show? explain your answer
second-degree heart block (Mobitz I) - Wenkebach = gradual prolongation of the P-R interval until eventually the subsequent QRS after a P wave is dropped
195
what does the following ECG show? explain your answer
atrial fibrillation = oscillating baseline = may have an irregular rhythm
196
what does the PR interval represent?
the time between atrial depolarization and ventricular depolarization
197
what does the PR segment represent?
the time delay between atrial and ventricular depolarisation
198
what does the QT interval represent?
the time from the beginning of ventricular depolarisation to the end of ventricular repolarisation
199
what does the ST segment represent?
the interval between the end of ventricular depolarization (QRS complex) and the beginning of repolarization (T wave)
200
differentiate between the PR interval and the PR segment
while the PR interval takes the P wave into account, the PR segment occurs from the end of the P wave to the peak of the QRS complex PR interval = time from atrial depolarisation to ventricular depolarisation PR segment = the time delay in the conduction of the electrical impulse as it travels through the AVN