Trading the Open Flashcards
(128 cards)
No matter how strong an open is what are the chances there will be a minor reversal and/or a major reversal?
No matter how strong a BO is on the Open there is an 80% chance there will be a Minor Reversal
and a 50% chance that there will be a MAJOR Reversal
3 Parts to the Day

3 Parts to the Day

Volume really is not important in the markets today
It doesn’t matter, TRADE WHAT IS RIGHT INFRONT of YOU
Volume really is not important in the markets today
It doesn’t matter, TRADE WHAT IS RIGHT INFRONT of YOU
Market Cycle = BO, CHANNEL and TR
There are only three things the market can do
- Be in a BO
- Be in a Channel
- Be in a TR

Market Cycle = BO, CHANNEL and TR
There are only three things the market can do
- Be in a BO
- Be in a Channel
- Be in a TR

(90% of the the trading days have at least to types of price action, traders are constantly looking for evidence of a transition from one cycle to another)
(10% of days are Strong Trend days)

(90% of the the trading days have at least to types of price action, traders are constantly looking for evidence of a transition from one cycle to another)
(10% of days are Strong Trend days)

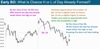
On average usually how many swings are there in a Trading Day?
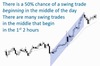
There is often 3 Swings in a Day

BOs, Channels, TRs all need to be traded differently
Be aware when one changes into another
Some days there is only 1 type of price action
BOs, Channels, TRs all need to be traded differently
Be aware when one changes into another
Some days there is only 1 type of price action
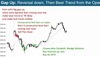
(No Opening Range on this Chart) Trend from the Open Bull Trend
and a Parabolic Wedge Top that reversed and formed the HIGH of the day

(No Opening Range on this Chart) Trend from the Open Bull Trend
and a Parabolic Wedge Top that reversed and formed the HIGH of the day

(Opening Range on this Chart) Tight TR Open for a couple of hours
Bulls bought the reversal Up and sold the reversal Down

(Opening Range on this Chart) Tight TR Open for a couple of hours
Bulls bought the reversal Up and sold the reversal Down

(Opening Range on this Chart) Market went sideways on the Open for several hours
Traders look to Trade Reversals buying Failed BOs near the bottom and buying HLs, selling DTs with reversals down

(Opening Range on this Chart) Market went sideways on the Open for several hours
Traders look to Trade Reversals buying Failed BOs near the bottom and buying HLs, selling DTs with reversals down

(Opening Range on this Chart) Gap Up with a DB the Bulls got a small Rally but it did not last long

(Opening Range on this Chart) Gap Up with a DB the Bulls got a small Rally but it did not last long

(Opening Range on this Chart) Bear Swing down from the Open Range

(Opening Range on this Chart) Bear Swing down from the Open Range

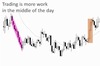
How many parts to the trading day do Traders Conclude that there is?
Traders conclude that there are 3 parts to the day, therefore they break them down into 3rds (Thirds)
The Open, what is it?…

The Open, what is it?…

Opening Reversals
In the first hour or two and sometimes in the very first minute of the day the market begins a Swing Trade and they’re SETUPS that often tell Traders a Swing Trade is about to being
Opening Reversals
In the first hour or two and sometimes in the very first minute of the day the market begins a Swing Trade and they’re SETUPS that often tell Traders a Swing Trade is about to being
Most days on the Open have some kind of BO before too long
Sometimes it is right on the Open
Most days on the Open have some kind of BO before too long
Sometimes it is right on the Open
No matter how strong a BO is on the Open there is an 80% chance there will be a Minor Reversal
and a 50% chance that there will be a MAJOR Reversal

No matter how strong a BO is on the Open there is an 80% chance there will be a Minor Reversal
and a 50% chance that there will be a MAJOR Reversal

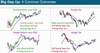
Big Gap Down = 4 Common Outcomes
i) DT near EMA
ii) Wedge Top near EMA
iii) Double Bottom
iv) Wedge Bottom (Nested wedge, micro db)
*80% of days will have something like this if the market has a big Gap Down & only 20% of the time the Gap down will continue to Selloff to the DS
*In fact even if there is no Gap at ALL 80% of the time chances are I will get one of these patterns

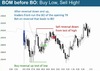
Big Gap Up = 4 Common Outcomes
i) DB near EMA
ii) Wedge Bottom near EMA
iii) Double Top
iv) Wedge Top
*Remember 80% of the time on any open I will get at least a minor reversal and 50% of the time I will get Major reversal even if the initial move is very strong
Big Gap Up = 4 Common Outcomes
i) DB near EMA
ii) Wedge Bottom near EMA
iii) Double Top
iv) Wedge Top
*Remember 80% of the time on any open I will get at least a minor reversal and 50% of the time I will get Major reversal even if the initial move is very strong

VERY IMPORTANT
ON THE OPEN NO MATTER HOW STRONG THE SELLOFF OR NO MATTER HOW STRONG THE RALLY, THERE IS A 50% CHANCE OF A REVERSAL… AGAIN NO MATTER HOW STRONG THE OPEN IS!
So DO NOT get fooled

VERY IMPORTANT
ON THE OPEN NO MATTER HOW STRONG THE SELLOFF OR NO MATTER HOW STRONG THE RALLY, THERE IS A 50% CHANCE OF A REVERSAL… AGAIN NO MATTER HOW STRONG THE OPEN IS!
So DO NOT get fooled

Opening Reversal - Early Reversal at Support or Resistance

Opening Reversal - Early Reversal at Support or Resistance

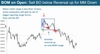
Big Failed Bear BO = TR More likely than a Bull Trend
If initial sell off is 25 - 50% of average range, the often get a big bull trend after reversal (Rally went far above)
If initial sell off is 50 - 100% of average range, then usually get a TR Day, even if big rally. Sometimes get a huge bull trend(not on this chart though)

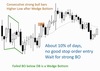
By the close of Bar 18 there is a 90% chance we have seen either the high or low of the day
By the close of Bar 18 there is a 90% chance we have seen either the high or low of the day
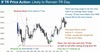
Big Failed Bull BO = TR More likely than a Bear Trend
If initial rally is 25 - 50% of average range, the often get a big bear trend after reversal (Selloff fell below open)
If initial sell off is 50 - 100% of average range, then usually get a TR Day, even if big rally. Sometimes get a huge bull trend