Sampling and Estimation Flashcards
Simple Random Sampling
Selection of a sample such that each item of the population has the same likelihood of being included in the sample.

Systematic Sampling
Selection of every nth member from a population.
Sampling Error

The difference between a sample statistic (mean, variance, s-dev) and its corresponding population parameter.

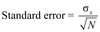
Sampling Error of the mean

Sampling Distribution
Probability distribution of all possible sample statistics computed from a set of equal sized samples randomly selected from the same population.
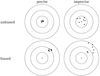
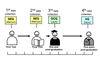
Stratified random sampling
Use of a classification system to separate the population into smaller groups based on one or more distinguishing characteristics.

Time-series data
Observations taken over a period of time at specific and equally spaced time intervals.
Cross-sectional data
Sample of observations taken at a single point in time.
Longitudinal Data
Observatiosn over time of multiple characteristics of the same entity
Panel data
Observations over time of the same characteristic for multiple entities
The size of the samples from each strata is based on the relative size of the strata relative to the population and not necessarily same across population
Classify the population into smaller groups based on one or more distinguishing characteristics
Take a random sample from each subgroup and pooled together.
The size of sample from each subgroup is based on relative of the group
Central Limit Theorem
For simple random samples of size n from a population with a mean of m and a finite variance, the sampling distribution of the same mean approaches a normal probability distribution with mean m and a variance equal to variance/n

Point estimates
Single (sample) values used to estimate population parameters.
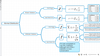
Confidence interval
Confidence intervals are usually constructed by adding or subtracting an appropriate value from the point estimate
* Point Estimate +_ Reliability factor x Standard Error*
Range of values within which the actual value of a parameter will lie, given the probability of 1 - a
Level of significance
α
Degree of confidence
1 - α
Confidence interval form
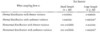
Desirable properties of an estimator
Unbiasedness, efficiency, and consistency.
Desirable properties of an estimator - definitions
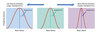
Student’s t-distribution
Bell-shaped probability distribution that is symmetrical about its mean.
Properties of student’s t-distribution
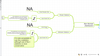
Confidence interval for the population mean (normal distribution with a known variance)
Commonly used standard normal distribution reliability factors

Confidence intervals for a population mean that is normal with unknown variance
Criteria for selecting the appropriate test statistic