Probability Concepts Flashcards
Arrange in proper direction following terms
Random Variable , Outcome , Event,
Random Variable
What is a random variable?
Random variable is an uncertain quantity/number.
What is an Outcome?
Outcome is an observed value of a random variable.
What is an Event?
Event is a single outcome or a set of outcomes.
What is an Mutually Exclusive Event?
Mutually exclusive events are events that cannot both happen at the same time.
What is an Exhaustive Event?
Exhaustive events are those that include all possible outcomes.
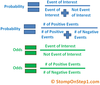
What are the two defining properties of probability and distinguish among empirical, subjective, and a priori probabilities?
- The probability of an event is between 0 and 1.
- A set of events that is mutually exclusive and exhaustive, the sum of the probabilities are the sum of 1.
What is a subjective probability?
Subjective probability is the least formal method of developing probabilities and involves the use of personal judgment.
What is empirical probability?
Empirical probability is analyzing past data.
What is priori probability?
Priori probably uses a formal reasoning and inspection process.
What are the odds of rolling a 1 on a 6 sided die?
1 to 5
What are the odds of not rolling a 1 on a 6 sided die?
5 to 1
Probability of Odds Or Probability of Occurance

What is Unconditional Probability (Marginal Probability) ?
Unconditional probability refers to the probability of an event regardless of the past or future occurrence of other events.
What is Conditional Probability?
Conditional probability is one where the occurrence of one event affects the probability of the occurrence of another event.
The key word to watch for here is “given”.
Explain the multiplication rule of probability?
P(AB) = P(A|B) x P(B)
The multiplication rule of probability is used to determine the joint probability of two events

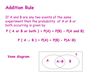
Explain the addition rule of probability?
P(A or B) = P(A) + P(B) - P(AB)
The additional rule of probability is used to determine the probability that at least one of the 2 events will occur

Explain the Total Probability Rule?
The total probability rule is uesd to determine the unconditional probability of an event,given conditional probabilities

What is joint probability?
Joint probability of two events is the probability that they will both occur.
We can calculate this from the conditional probability that A will occur ( a conditional probability) and the probability that B will occur (the unconditional probability of B) .
This calculation is sometimes refered to as the multiplication rule of probability .
P(AB) = P(A/B) X P(B)
What is the difference between a dependent and independent event?
Independent event does not have any influence on occurrences of others.
The definition of independent events can be expreseed in terms of conditional probabilities . Events A and B are independent if and only if :-
P(A/B) = P(A) or equivalently P(B/A) = P(B)
If this condition is not satified the events are dependent events .
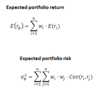
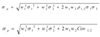
Standard Deviation of 2 stock portfolio
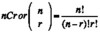
Factorial Notation
Use when assignment of members of a group to an equal number of positions
Multiplication Rule of Probability
P(AB) - P(A | B) x P(B)
Used to determine the joint probability of two events.
Addition Rule or Probability
Used to determine the probability that at least one of two events will occur:
P(A or B) = P(A) + P(B) - P(AB)
Total Probability Rule
Used to determine the unconditional probabiliyt of an event, given conditional probabilities:
P(A) = P(A | B1)P(B1) + P(A | B2)P(B2) +…+ P(A | Bn)P(Bn)
where B1, B2….Bn is a mutually exclusive and exhuastive set of outcomes.
Joint Probability
The joint probability of two events is the probability that they will both occur. We can calculate this as such:
P(AB) = P(A | B) x P(B)
Independent Events
Refer to events for which the occurrence of one has no influence on the occurrence of the others:
P(A | B) = P(A) or equivalently P(B | A)=P(B)
If this condition is not satisfied, the events are dependent events.
Expected Value
Allows us to determine the average value for a random variable that results from multiple experiments. It is essentially our best guess. From it we can calculate variance or std. dev or returns etc
Covariance
Is a measure of how two assets move together. it is the expected value of the product of the deviations of the two random variables from their respective expected values.
Properties of Covarinace
1: -Covariance is a general representation of the same concept as the variance. that is, the variance measures how a random variable moves with itself, and the covariance measures how one random variable moves with another random variable.
2: - The Cov of Ra with itself is equal to the variance of Ra.
3: - The Cov may range from negative to positive infinity.
Covariance Formula
Properties of variance and covariance
(a) If [$ X$] and [$ Y$] are independent, then [$ {\rm Cov}(X,Y) = 0$] by observing that [$ E[XY] = E[X] \cdot E[Y]$] .
(b) In contrast to the expectation, the variance is not a linear operator. For two random variables [$ X$] and [$ Y$] , we have
[$\displaystyle {\rm Var}(X + Y) = {\rm Var}(X) + {\rm Var}(Y) + 2 {\rm Cov}(X,Y).$] (3)
However, if [$ X$] and [$ Y$] are independent, by observing that [$ {\rm Cov}(X,Y) = 0$] in ( [*] ), we have
[$\displaystyle {\rm Var}(X + Y) = {\rm Var}(X) + {\rm Var}(Y).$] (4)
In general, when we have a sequence of independent random variables [$ X_1,\ldots,X_n$] , the property ( [*] ) is extended to[$\displaystyle {\rm Var}(X_1 + \cdots + X_n) = {\rm Var}(X_1) + \cdots + {\rm Var}(X_n). $]
Variance and covariance under linear transformation. Let [$ a$] and [$ b$] be scalars (that is, real-valued constants), and let [$ X$] be a random variable. Then the variance of [$ aX + b$] is given by
[$\displaystyle {\rm Var}(aX + b) = a^2 {\rm Var}(X). $]Now let [$ a_1$] , [$ a_2$] , [$ b_1$] and [$ b_2$] be scalars, and let [$ X$] and [$ Y$] be random variables. Then similarly the covariance of [$ a_1 X + b_1$] and [$ a_2 Y + b_2$] can be given by[$\displaystyle {\rm Cov}(a_1 X + b_1, a_2 Y + b_2) = a_1 a_2 {\rm Cov}(X,Y) $]
Correlation

Correlation Coefficient
:- makes the covariance of two random variables easier to interpret.
:-Correlation measures the strength of the linear relationship between two random variables.
- Correlation has no units.
- Correlation ranges from -1 to +1.
- If Correlation = 1 then the random variables have perfect positive correlation. A movement in one random variable results in a proportional positive movement in the other relative to its mean.
- If Correlation = -1 then the variances have perfect negative correlation. A movement in one random variable results in an exact opposite proportional movement in the other relative to its mean.
- If Correlation = 0 there is no linear relationship between the variables, no prediction of Ri can be made on the basis of Rj.

Properties of Correlation
- Correlation requires that both variables be quantitative (numerical).
You can’t calculate a correlation between “income” and “city of residence” because “city of residence” is a qualitative (non-numerical) variable.
- Positive r indicates positive association between the variables, and negative r indicates negative association.
A positive r indicates that above average values of x tend to be matched with above average values of y and below average values of x tend to be matched with below average values of y.
POSITIVE r high with high, low with low
A negative r indicates that above average values of x tend to be matched with below average values of y and below average values of x tend to be matched with above average values of y
NEGATIVE r high with low, low with high
- The correlation coefficient (r) is always a number between -1 and +1.
Values of r near 0 indicate a very weak linear relationship. The extreme values of -1 and +1 indicate the points in a scatterplot lie exactly along a straight line.
- The correlation coefficient (r) is a pure number without units.
r is not affected by:
–interchanging the two variables
(it makes no difference which variable is called x and which is called y)
–adding the same number to all the values of one variable
–multiplying all the values of one variable by the same positive number
Because r uses the standardized values of the observations, r does not change when we change units of measurement (inches vs. centimeters, pounds vs. kilograms, miles vs. meters). r is “scale invariant”.
- The correlation coefficient measures clustering about a line, but only relative to the SD’s.
Pictures can be misleading.
- The correlation can be misleading in the presence of outliers or nonlinear association.
r does not describe curved relationships. r is affected by outliers. When possible, check the scatterplot.
- Ecological correlations based on rates or averages tend to overstate the strength of associations.
- Correlation measures association. But association does not necessarily show causation.
Both variables may be influenced simultaneously by some third variable.
Expected Value (Portfolio)
The expected value of a portfolio composed of n assets with weights, wi, and expected values, Ri, can be determined with this formula.

Portfolio Variance
Portfolio variance uses weights as well.

Portfolio Variance (2 Risky Assets)

Bayes’ Formula
Used to update a given set of prior probabilities for a given event in response to the arrival of new information: Updated probability =
Bayes’ Formula 2

Labeling
Refers to a situation where there are n items that can each receive one of k different labels. The number of items that receives label 1 is n1 and the number that receive label 2 is n2, and so on, such that n1+n2+…+nk=n. The total number of ways that labels can be assigned is:

Combination Formula
A special case of labeling arises when the umber or labels equals 2 (k = 2). nCr is the number of possible ways of selecting r items from a set of n times when the order of selection is not important. “n choose r”

Permutation Formula
A permutation is a specific ordering of a group of objects. The question of how many different groups of size r in specific orders can be chosen from n objects is answered by the permutation formula:

Determining Which Counting Method To Use
Multiplication rule
**Multiplication Rule **
Multiplication rule of counting is used when there are two or more groups. The key is that only one item may be selected from each group. If there are k steps required to complete a task and each step can be done in n ways, the number of different ways to complete the task is n1! x …. x nk!
Determining Which Counting Method To Use
Permutation
Permutation
The permutation formula applies to only two groups of predetermined size, look for a specific reference to order being important.
Determining Which Counting Method To Use
Factorial
Factorial
Factorial is used by itself when there are no groups - we are only arranging a given set of n items. Given n items, there are n! ways of arranging them.
Determining Which Counting Method To Use
Combination
Combination
The combination formula applies to only two groups of predetermined size. Look for words choose or combination.
Determining Which Counting Method To Use
Labeling
Labeling
The Labeling Formula applies to three or more sub-groups of predetermined size. Each element of the entire group must be assigned a place, or label, in one of the three or more sub-groups.
A discrete probability distribution is the same as
A relative frequency distribution
Two events A and B are mutally exclusive if
P(A and B) = 0
Two events A and B are independent then
P(A and B) = P(A) P(B)
Baye’s Theorem Formula
