Hypothesis Testing Flashcards
(105 cards)
Hypothesis
statement about the value of a population parameter developed for purpose of testing a theory or belief
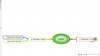
Hypothesis Testing Procedure (picture pg 298 book 1)
j
Null Hypothesis
Designated Hο, hypothesis that the researcher wants to reject. Actually texted and is basis for selection of test stat. Always “equal to” condition
Alternative Hypothesis
Há, what is concluded if there is sufficient evidence to reject the null. Usually alternative hypo trying to assess.
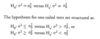
One-tailed Two-tailed
one - if return is greater than zero two - if research question is returns different from zero Hο:µ=µο vs Há:µnot=µο
Reject Hο if:
Test statistic > upper critical value or Test statistic < lower critical value
Hypo testing - two statistics
Test statistic calculated from sample data Critical value of test statistic
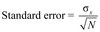
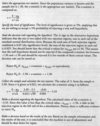
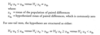
Test Statistic =
(Sample Stat - Hypo Value) / Standard error of sample stat
Type I Error
rejection of null hypo is actually true
Type II Error
Failure to reject the null hypothesis when actually false
Significance Level
The probability of making a Type I Error and designated alpha letter
Decision Rule
Based on the distribution of the test statistic. Must figure out one tail or two tails before decision rule -specific and quantitative -test statistic (greater / less than) X, reject the null
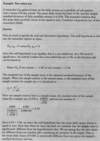
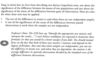
Power of a test
probability of correctly rejecting the null when it is false. 1-probability of making a Type II error, or 1-P (Type II error) Rejecting null when false (power of test) equals one minus the probability of NOT rejecting the null when it is false (type II error)
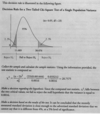
Level significance, power of a test, and type two errors. (pg 303 book 1 picture)
…
Decreasing significance level
(probability of type II error) will increase probability of failing to reject the null, and decreasing power of test. and vice versa
Confidence Level (formula pg 304 book 1)
…
Confidence level interval
-critical value ≤ test statistic ≤ +critical value Range within which we fail to reject the null for a two-tailed test at a given level of significance
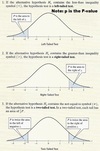
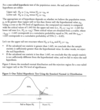
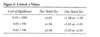
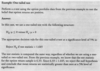
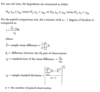
P-Value
Probability of obtaining a test statistic that would lead to a rejection of the null, assuming the null was true. -Smallest level of significance for which null can be rejected One tail- pval is probability that lies above the positive value of the computed test stat for upper tail tests, or below for lower tailed tests. Two tail -pval probability that lies above the positive val of the compound test stat plus the probaility that lies below the negative value of the computed test stat
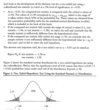
T-Test Picture pg 307 book 1
employes a test stat that is distributed according to a t-distribution. Use if: Variance unknown sample is large (n≥30 Sample is small (less than 30) but distribution of population is normal
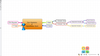
Z-Test picture pg 308 book 1
when population is normally distributed with a known variance Z val is compared to the significance of test.
Memorize this picture pg 308 book 1
…
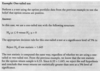
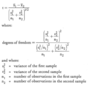
When samples are independant
Use the difference in mean test
When samples are dependant
statistic is average difference in (paired) observations divided by the standard error of the average difference
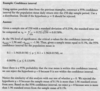
Chi-square test
used for hypothesis tests concerning the variance of a normally distributed population. Distribution is asymmetrical and approaches the normal distribution in shape as the degrees of freedom increase