Econometrics Flashcards
(225 cards)
Typical Problems Estimating Economic Models - High multicollinearity
Definition: Two or more independent variables in a regression model exhibit a close linear relationship.
Consequences:
- Large standard errors and insignificant t-statistics
- Coefficient estimates sensitive to minor changes in model specification
- Nonsensical coefficient signs and magnitudes
Detection:
- Pairwise correlation coefficients
- Variance inflation factor (VIF)
Solution:
- Collect additional data.
- Re-specify the model.
- Drop redundant variables.
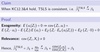
Typical Problems Estimating Economic Models - Heteroskedasticity
Definition: The variance of the error term changes in response to a change in the value of the independent variables.
Consequences:
- Inefficient coefficient estimates
- Biased standard errors
- Unreliable hypothesis tests
Detection:
- Park test
- Goldfeld-Quandt test
- Breusch
- Pagan test
- White test
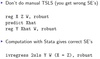
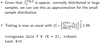
Solution:
- Weighted least squares (WLS)
- Robust standard errors
Typical Problems Estimating Economic Models - Autocorrelation
Definition: An identifiable relationship (positive or negative) exists between the values of the error in one period and the values of the error in another period.
Consequences:
- Inefficient coefficient estimates
- Biased standard errors
- Unreliable hypothesis tests
Detection:
- Geary or runs test
- Durbin-Watson test
- Breusch-Godfrey test
Solution:
- Cochrane-Orcutt transformation
- Prais-Winsten transformation
- Newey-West robust standard errors
Rules for the mean

Rules for the variance

Rules for the covariance
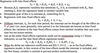
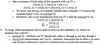
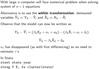
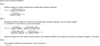
- Let X, Y, and V be random variables; let mX and s2X be the mean and variane of X and let sXY be the covariance between X and Y; and let a, b, and c constants. The following rules follow:
- E(a + bX + cY) = a + bmX + cmy
- Var(a + bY) = b2s2Y
- Var(aX + bY) = as2X + 2absXY + b2s2Y
- E(Y2) = s2Y + m2y
- Cov(a + bX + cV, Y) = bsXY + csVY
- E(XY) = sXY + mxmy
corr(X,Y) | ≤ 1 and |sXY| ≤ Ös2Xs2Y (correlation inequality)

Formulas variance, covariance, sd

Rules correlation
Limit for unusual data
Below : µ-2σ
Above: µ+2σ
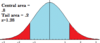
Empirical rule for normal distribution
About 68% of the data falls within: µ-σ to µ+σ
About 95%: µ-2σ to µ+2σ
About 99.7%:µ-3σ to µ+3σ
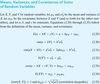
Least-squares line coefficients

Modified boxplot outliers

Why use panel data in regression?
- using panel data is one way of controlling for some types of omitted variables without actually observing them
panel data definition
- panel data: data in which each observatioal unit, or entity. is observed at two or more time periods; by studying changes in the dependent variable over time, it is possible to eliminate th effect of omitted varibales that differ across entities but are constant over time; more formally: data for n different entities observed at T different time periods
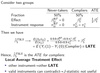
- example: effet of alcohol taxes and drunk driving laws on traffic fatalities in the US: use data across states over multiple years - this lets us control for unobserved variables that differ from one state to the next but do not change over time, e.g. cultural attitudes toward drinking and driving. It also allows us to control for variables that vary through time, but do not vary across states, e.g. improvements in the safety of new cars.
cross-sectional data
- Cross-sectional data, or a cross section of a study population, is data collected by observing many subjects at one point or period of time. Analysis of cross-sectional data usually consists of comparing the differences among selected subjects.
- Cross-sectional data differs from time series data, in which the entity is observed at various points in time. Another type of data, panel data (or longitudinal data), combines both cross-sectional and time series data ideas and looks at how the subjects (firms, individuals, etc.) change over a time series.
balanced / unbalanced panel
balanced: has all its observations, i.e. varibales are observed for each entity and each time period
panel data: before / after comparisons
by focusing on changes in the dependent variable over time, this differences comparison holds constant the onobserved factors tht differ from one state to the next but do not change over time within the state
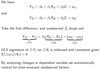
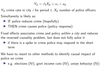
how panel data eliminates effect of unobserved variables that do not change over time
because Zi (e.g. attitude toward drinking and driving) does not change over time, it will not produce any change in the fatality rate between two time periods. Thus, in the regression model, the influence of Zi can be eliminated by analyzing the change in the dependent variable between the two periods. If there is a difference between the two y-values, the change must have come from ohter sources, e.g. your independent variables or your error terms
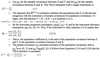
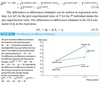
why include an intercept?
allows for the possibility that the mean change in e.g. the fatality rate, in the abscence of a change in the real beer tax, is nonzero. For example, a negative intercept could reflect improvements in auto safety between two time periods that reduced the average fatality rate
does “before and after” method work for T>2?
not directly; to analyze all the observations in a panel data set, use the method of fixed effets regression
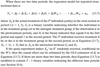
fixed effects regression
is a method for controlling for omitted variables in panel data when the omitted variables vary across entities, but do not change over time; T can be greater than 2
fixed effects regression model

entitity-specific intercepts as binary variables

entity-demeaned OLS algorithm