Week 3 Consumption and Labour choices Flashcards

1
Q

What will we be looking at this week?

A

We are going to be thinking about how individuals decisions affect the economy, we will look at indifference curves, budget constraints, subsitution and income effect,and profit maximisation.

2
Q

Remember from the solow growth model, how do we model consumers?

A

We assume there is a representative consumer, as all consumers are identical to each other.

3
Q

What are the 2 goods we are going to assume that the consumer only cares about?

A

Consumption ( donughuts) and Leisure ( watching netflix)

4
Q

What are the 3 assumptions we will make about consumption and leisure?

A

1) More is better than less ( I prefer 1 more donughut or one more lesiure time, as they give you more utlitiy)
2) Variety - equal bundles of consumption ie 3 donughtus and 3 lesiures, is preffered than 1 donughut and 5 lesiure time
3) Consumption and lesiure are normal goods ( if income increases the demand for both goods increase.

5
Q

What are we going to use to illustrate the bundles of the 2 goods consumption and lesiure ?
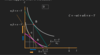
A

Indifference curves

6
Q

What do indifference curves tell us?

A

They tell us the bundle of goods in which consumers are indifferent between, ( they represent different levels of happiness of a consumer)

7
Q

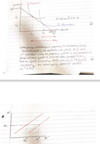
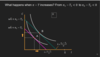
Illustrate the diagram with indifference curves and the slope of the indifference curve, what is it called?

A
8
Q

The slope of the indifference curves is minus the marginal rate of subsitution between leisure and consumption. What does this mean?

A

The marginal rate of subsitution of lesiure and consumption is the rate at which the consumer is just willing to subsitute lesiure for consumption goods.

9
Q

What is a budget constraint?

A

Depicts what a consumer can buy.

10
Q

What are 2 more assumptions of the representative consumer?

A

1) Competitive behaviour: Consumers are price takers ( there behaviour will not affect how prices are set)
2) This is a barter economy ( there is no monetary exchange, we barter consumption goods for leisure

11
Q

As we are in a barter economy money is expressed by what?

A

How many donughuts i get from one hour of work

12
Q

What is the time constraint of this representative ocnsumer?

A

The consumer in our economy has a total amount of hours ( h bar), which he can spend in 2 ways, watching netflix and working for a salary.( consumption good)

13
Q

How is the consumer able to get consumption and what is it called?

A

Total wages income, plus dividend income - minus taxes

( we assume consumers owns firms in the economy and there is a government hence taxes)

this is consumers budget constraint.

14
Q

How does the consumer budget constraint look like?

A

The real wage times labour supply ( how many hours i work), tells us how many consumption goods you will get for an hour of lesiure taken away.

15
Q

As we know from our assumptions consumers like to consume the most they can how should the budget constraint actually look like?

A
16
Q

How can we use the time constraint and the consumer budget constraint to get an equation where the budget constraint is expressed in terms of the 2 goods in the economy ( C and L)

A
17
Q

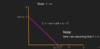
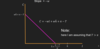
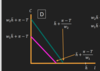
Illustrate the budget constraint on the diagram and what are we assuming

A

h BAR + profit - taxes/w is negative as T>profit

18
Q

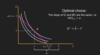
What do we mean by a consumer is rational when picking his optimal choice?

A

The consumer will reach the bundle with the highest possible happiness given its prices and disposable income.

19
Q

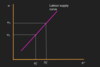
Draw an indifference curve with the budget constraint and where is the optimal choice of the consumer?

A

The difference between opitmal lesiure chosen and maximum amount of hours worked is the number of hours the worked by the consumer.

The slope of the indifference curve = the slope of the budget line.

20
Q
A

1) The first thing that happpens is that the X intercept is bigger than H bar, which is impossible as h bar is the maxmium amount of hours in the day, you cant have 26 hours in a day, so there will be a bundle of goods that are not possible.

So now the horizontal intercept is H bar and the consumption is at the kink ( profit - taxes)

21
Q

What effect is there? This means government cut taxes or dividends go up.

A

1) The vertical intercept will go up but it is still negative
2) The horizontal intercept will go up but still negative
3) The optimal choice will be larger at point B, higher consumption and lesiure, but the slope hasnt changed

There is only an income effect ( as C and I have increased)

22
Q

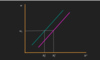
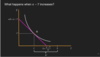
What happens when there is an increase in the real wage

Does the slope change?

What is my optimal choice

A

1) if profit minus taxes are negative we assume,and there is an increase in real wage the horizontal intercept will be higher
2) The veritcal intercept will be higher, as you are dividing by a bigger Quanitiy but it is negative, so the interecpt will be higher.
3) The slope of the budget constraint does change, remember the slope is -w, implying the new budget constraint will be steeper than orignal line.
4) With an increase in wage rate, my optimal choice includes a reduction in leisure and an increase in consumption

23
Q

When the slope changes what is there always ?

A

An income and subistution effect

24
Q

Show the income and subsitution effect when the real wages increase and what are the steps?

A

To do this draw a parralel line from the new budget constraint, tangent to the orignial indifference curve.

2) The movement from A to C is the substitution effect, this means that the relative prices between leisure and consumption have chnaged, as lesuire becomes more expensive, when real wage goes up and consumption is relatively cheaper.
3) if i want to have the same happiness as i had at point A, before price change, i will consume at point C, as i am on the same indifference curve
4) The movement from C to B highlights an income effect, an increase in income and the fact that C AND L are normal goods, mean we consume more of both.

25
Q

What effect dominates here the subsitution or income effect

A

Consumption - The subistiution effect > income effect ( you change you consume more of one and less of the other.

26
Q

Show an increase in wages, leading to a situation where the income effect is bigger than the subsitution effect?

Why does the income effect dominate?

A

The income effect dominates because as the real wage goes up. you are consuming more of both goods because both goods are normal goods, the subsitution effect is smaller than income effect.

27
Q

So when the real wage increases, and the subistution effect dominates the income effect this implies that we want to work more and increase consumption and have less leisure, from this what can we draw?

A

We can draw the labour supply of the consumer

Assuming the subsitution effect is greater than the income effect ( actually for very high wages the curve bends backwards as the subsitution effect doesnt dominate the income effect, but not relevant, as income effect is stronger)

28
Q

What happens to the labour supply when there is an increase in ( pie ( profits) - Taxes)?

A

As we have seen before there is only an income effect, so this means, you are going to work less hours, so the curve will shift to the left, for the same level of the wage, you want to work less

29
Q

During the last few months, there has been a dramatic drop in aggregate consumption caused by the pandemic. Part of this consumption drop can be attributed to the fear of infection. For example, consumers would not eat in restaurants for fear of being exposed to the virus.

Using only the representative consumer model we have been analysing, can you describe what this shift in preferences implies for consumption and leisure choices? What are the consequences for the labour supply? Do you think this is a plausible explanation of what really happened? What do you think this model is missing?

A

There would be a change in preferences in consumption and lesiure, hence the indifference curve would change from I1 to I2. People will value lesiure more and value consumption less, hence labour supply would shift to the left, as for the same wage rate you want to work less.

30
Q

What are we assuming about the economy?

A

It is a closed one period economy, when looking at competitive firms and consumers.

31
Q

We are we going to assume about firms?

A

All firms are identical, we must have a look at one, representative firm

32
Q

What is the production function of a representative firm and due to the fact it is a one period model what are we keeping fixed?

A

The same as the one in the solow growth model, due to the fact that it is a one period model, we are keeping capital fixed ( firms cant make decisions about how much to invest)

33
Q

As firms cant influence price, what are they?

A

Price takers.

34
Q

What are the properties of the production function ( which is the same as the solow growth model? (5 properties)

A

1) Constant returns to scale
2) Output increases with increases in either labour input or capital input
3) The marginal product of labour decreases as the labour input increases
4) The marginal product of capital decreases as the capital input increases
5) The marginal product of labour increases as the quanitiy of the ccapital input increases and vice versa.

35
Q

What is the equation for firms to maximise profits?

A

The profit maxmising equation is

the production function ( fixed capital and to maxmise profit, firms need to make a decision of how much workers to hire, for labour demand)

take away the total amount of wages paid to workers.

36
Q

What is the difference between intratemporal model and intertemporal model?

A

intratemporal model = one period( we are looking at this)

Intertemporal model = more than one period

37
Q

What will firms keep doing to max profits?

A

They will keep hiring an additional worker as long as hte marginal product of an additional worker is higher than the additional cost of an additional worker.

They will stop hiring new workers, at the point at which the marginal product of labour = real wage

MPN = W

38
Q

Show this expression graphically MpN = W

A

The marginal product of labour which implies more workers = lower marginal product, if i hire additional workers when i have a lot of workers, the production will increase but not that mich, when i have a very few workers prodcution increases by a lot.

39
Q

If there is a prevailing wage w1 given what will firms do?

A

The firm will pick the number of workers cocrresponding to that wage rate, to maxmise profits.

40
Q

So far we have a representative consumer and firm, and we know there behaviour, now what are we going to assume there are?

A

Goverment spending ( and this is financed by taxes)

41
Q

What is the difference between Exogenous variables and Endogenous variables?

A

Exogenous variables = variables determined outside the model

Endogenous variables = Variables determined in the model.

42
Q

Give examples of Exogenous and Endogenous variables?

A

Exogenous ( government spending, Z, K)

Endogenous ( Consumption, labour demand and supply, taxes, output, real wage)

43
Q

What is the competitive equibirum in this one period model?

A
  • Representative consumer chooses C and 𝑁𝑆 optimally (max happiness) given market price w, taxes T and dividends πœ‹
  • Representative firm chooses 𝑁𝑑 optimally (max profits πœ‹) given market price w, total factor productivity z and capital 𝐾(fixed)
  • The labour demand is equal to the labour supply
  • The government budget constraint is satisfied, or G = T.
44
Q

Wait a second there are 2 goods ( Labour or lesiure and Consumption, what can we show?

A

We are going to show this being satisifed automatically once we have this other requirement of this competittive equibrium being satsified.

45
Q

How do we show that the 2 markets her labour and consumption are not in 2 markets?

A

Y = C + G ( equibrium in the goods market)

Proof

we assume the consumers constraint has all the compeittive quanitiites.

Profits = production - cost of paying workers

We plug all the components into the representatitve consumer budget constraint, when we know labour demand and supply equal, so cancel out and we are left with C = Y-G.

46
Q

We are now trying to draw the production function, what is our main goal?

A

We are trying to get consumption on the horizontal axes and lesiure on the vertical axes, because if not, we would have to draw 2 diagrams, so it will involve drawing 3 diagrams.

47
Q

Draw the production function and what do we have to do next?

A

The slope is Mpn = w

Depending on real wage, we are going to tell the quanitiy of labour inputs, that is brought by firm

h bar is the max amount og hours worked

We want to transform this diagram so we have on leisure on the vertical axes and output on the horizontal axes.

48
Q

How can we expand the production function, so we get the Labour inputs expanded and what does it mean for our graph?

A

Y = zF( K,N) ( K bar)

N = h bar - l

this is becuase the max amount of hours working must = total amount of hours in a day take away lesiure time ( watching netflix)

So we can trasnslate this onto a diagram in terms of output and leisure ( on this diagram if you are having no lesiure, you must be working so output is high, if you are having all lesiure, you are not working so output is low), we can do that for all points to get the diagram.

Notice slope becomes negative

49
Q

So now we want to get a diagram we we have consumption on the horizontal axes and lesiure on the vertical axes, but what does consumption equal in a comptetitive equibirium?

A

If i consume Y* on diagram 2, it means in diagram 3 i can consume Y* - G

So we can just translate the 2 curve and move it down to an amount equal to G

50
Q

So draw the diagram in terms of consumption and lesiure

What is the slope?

A

If you send all your hours watching netflix, you are consuming 0 ( as you are not producing anything) - G, which is negative, but we cannot have negative consumption so we cross that out

Similarily, if you are working, the max hours, you are having max output and take away G, will mean the highest consumption, so now we can draw diagram.

Slope the same as 2

51
Q

What is the diagram, of consumption and lesiure called and what does it tell you?

A

Its called the PPF, this tells you all the possible lesiure and consumption that this economy can produce ( IK you cant produce lesiure but you know what i mean.), given the technology avaliable in the economy.

52
Q

What does the slope of the PPF tell you?

A

The marginal rate of transformation ( the rate at which one good can be technologically converted into another good.) in this example if i give away one unit of leisure how many units of consumption will i get technogically speaking.

This is equivalent to negative the marginal product of labour.

53
Q

Summarise the optimal behaviour for firms and consumers?

A

Consumers choose consumption and lesiiure such that

Firms choose leisure such that 𝑀𝑃𝑁 = 𝑀

Consumers choose consumption and leisure such that: 𝑀𝑅𝑆𝑙,𝐢 = 𝑀

● Therefore in a competitive equilibrium we must have 𝑀𝑅𝑆𝑙,𝐢 = 𝑀𝑅𝑇𝑙,𝐢 = 𝑀𝑃𝑁 ( = 𝑀)

54
Q

Show the optimal choice of consumers and firms on a diagram using the consumption and lesiure diagram?

A

1) We add the indifference curve of the consumers, consumers pick an indiffernce curve such that the slope Marginal rate of substution between l and C = the slope of the bugdet constraint, which are both negative ( -MRS AND - SLOPE OF BUDGET CONSTRAINT which equals wage rate (-W)
2) Firms hire workers such that - slope of the PPF OR MPN equals the wage rate, which is minus the slope of the budget constraint.
3) This determines a point, that gives equilbirum consumption and lesuire

The difference between h bar and L is the number of workers working

55
Q

Is this a competitive equibirium?

A

This is not a competitive equilbirum as you can see firms want to hire less people than consumers want to work, so there is no market clearing.

56
Q

Is this a competitive equilbirum?

A

Nope because the worker wants to work little as ( H bar - l2) < (H bar - L1) and firms want to higher a lot workers, meaning wage is low.

57
Q

What does Pareto optimatlity mean?

A

an allocation of production in society is Pareto efficient, if for any other allocation of production in which someone is better off, there is someone who is worse off.

58
Q

How do we get a pareto efficient allocation?

A

Social planner ( all the omins), he can do whatever he wants, in the economy, he can produce how many consumption goods he wants and how many workers to hire.

He has to choose a consumpttion bundle and lesuire on the PPF and on the highest indifference curve possible.

59
Q

What are the equations the social planner has to satisfy?

A

the slope of the indifference curve = the slope of the ppf = labour demand = w

60
Q

Show a pareto efficient allocaiton from the social planner?

A

The indifference curve must not touch the PPF in 2 points, you must get on the highest indifference curve touching one point, given technology avaliable.

61
Q

What is the first welfare theroem?

A

Under certain conditions, a competitive equibirum is pareto optimal.

62
Q

What is the second welfare theorem?

A

Under certain conditions a pareto optimal allocation can be attianed by a compeitive equilibrum ( there exists a set of prices, in our case real wage that consumers and firms will pick that wage which is a pareto optimal allocation)

63
Q

What does the second welfare theorem not involve?

A

A social planner.

64
Q

Show the second welfare theorem on the diagram?

A

You just find the pareto optimal allocation, then find the right wage, which is a competitive equilbrium choosen under the rules of a competitive equilbrium.

1) find pareto optimal allocation ( slope of indifference curve = slope of the ppf, dont draw bugdet line yet)
2) Now i have to find a real wage, such that the consumer wants to pick the optimal C AND L, and firms want to hire as many workers implied by H bar - L*
3) you just choose the one that corresponds to the slope of the budget line, ( this will mean MRSl,c = MRT = MPN = w

65
Q

What are the conditions in which a compeititive equibrium can be satisfied?

A

No exernalities

Distortionary taxes ( not lump sum taxes)

Market power ( if we have a monopoly or oligopoly, we will not reach a socially optimum level)

Information problems ( adverse selection or moral hazard)

66
Q

Is the social planner the governement?

A

Nope, the government have their own incentives, leading to a conflict of interest.

67
Q

What happens to the competitive equibrium or pareto optimal allocation with an increase in G. ( using consumption and lesiure diagram)

A

1) The y intercept of the PPF, will shift down
2) Lower indifference curve, meaning lower consumption and more hours worked.

68
Q

What is another way to think about the effect of an increase in Government spending?

A

It is a pure income effect ( lesiure decreases, consumption decreases, whilst Y increases and W falls.) This is because consumption and lesiure are normal goods.

The increase in Governemnt spending crowds out private sector consumption, as it means higher taxes, so consumers have to work more to get the same relative wage.

69
Q

What happens if there is an increase in Total factor productivity ( which is the same as an increase in capital ( but capital is constant, so we dont really do that) ?

A

1) PPF will shift upwards, as for the same amount of workers, each worker is going to be more productive, thus more output. ( the slope is increased)
2) This leads to more consumption and less lesuire. ( thus there is an income and subistution effect, when there is a change is slope)

70
Q

How can i show a Income and subistution effect of an increase in Z?

A

1) First of all i need to replicate a fake ppf, of new and move it down till it is tangent to the original indifference curve.
2) The change from E0 and A, isolates the subsitution effect, and the movement from A to E1 shows the income effect
3) The subsituiton effect shows a reduction in lesiure and increase in consumption.
4) The income effect moves in the same direction for the consumption upwards but for lesiure it moves the opposite direction ( increases lesiure)

71
Q

What happens to the wage?

A

As the new PPF is steeper, meaning the Marginal product of labour goes up, so wage is higher in the new equlibrium.

72
Q

For the subsitution effect and income effect of consumption and lesiure for an increase in z, what can we dedcue?

A

C increases for both effects, but lesiure may increase or decrease depending which effect is stronger, here the substiution effect is stronger, so we have a reduction in lesiure,menaing an increase in employment.

73
Q

Springfield The city of Springfield exists only for one season, after which the show is cancelled and there is no Springfield anymore. Consumers are all identical, hence we will look at the representative consumer of this economy: Homer Simpson. There is only one firm, Mr Burns Ltd, which produces donuts with labour and capital. Capital is fixed, and given. The production function is given by

π‘Œ = 𝑧𝐾‾𝑁

Homer thinks of consumption and leisure as perfect substitutes. Hence, his indifference curves can be represented as

𝑒 = π‘Žπ‘™ + 𝑏𝐢 where π‘Ž and 𝑏 are positive constants, 𝐢 is consumption (donuts), 𝑙 is leisure (watching TV), and 𝑒 is a generic level of happiness for Homer. In other words, indifference curves are straight lines. By increasing 𝑒, we can draw indifference curves that make Homer happier.

Homer has a maximum number of hours per day equal to β„Žβ€Ύ, he works for a wage 𝑀, and owns (as does every other consumer in Springfield) a share of Mr Burns Ltd. Assume that dividends πœ‹ = 0. The Springfield Mayor is on holiday, so 𝐺 = 0.

a. Draw the budget constraint that Homer faces.

A
74
Q

Springfield The city of Springfield exists only for one season, after which the show is cancelled and there is no Springfield anymore. Consumers are all identical, hence we will look at the representative consumer of this economy: Homer Simpson. There is only one firm, Mr Burns Ltd, which produces donuts with labour and capital. Capital is fixed, and given. The production function is given by

π‘Œ = 𝑧𝐾‾𝑁

Homer thinks of consumption and leisure as perfect substitutes. Hence, his indifference curves can be represented as

𝑒 = π‘Žπ‘™ + 𝑏𝐢 where π‘Ž and 𝑏 are positive constants, 𝐢 is consumption (donuts), 𝑙 is leisure (watching TV), and 𝑒 is a generic level of happiness for Homer. In other words, indifference curves are straight lines. By increasing 𝑒, we can draw indifference curves that make Homer happier.

Homer has a maximum number of hours per day equal to β„Žβ€Ύ, he works for a wage 𝑀, and owns (as does every other consumer in Springfield) a share of Mr Burns Ltd. Assume that dividends πœ‹ = 0. The Springfield Mayor is on holiday, so 𝐺 = 0.

Given Homer’s preferences, find the optimal allocation. Show that it depends on the relationship between π‘Ž 𝑏 and 𝑀.

A

Rearrange equation

75
Q

pringfield The city of Springfield exists only for one season, after which the show is cancelled and there is no Springfield anymore. Consumers are all identical, hence we will look at the representative consumer of this economy: Homer Simpson. There is only one firm, Mr Burns Ltd, which produces donuts with labour and capital. Capital is fixed, and given. The production function is given by

π‘Œ = 𝑧𝐾‾𝑁

Homer thinks of consumption and leisure as perfect substitutes. Hence, his indifference curves can be represented as

𝑒 = π‘Žπ‘™ + 𝑏𝐢 where π‘Ž and 𝑏 are positive constants, 𝐢 is consumption (donuts), 𝑙 is leisure (watching TV), and 𝑒 is a generic level of happiness for Homer. In other words, indifference curves are straight lines. By increasing 𝑒, we can draw indifference curves that make Homer happier.

Homer has a maximum number of hours per day equal to β„Žβ€Ύ, he works for a wage 𝑀, and owns (as does every other consumer in Springfield) a share of Mr Burns Ltd. Assume that dividends πœ‹ = 0. The Springfield Mayor is on holiday, so 𝐺 = 0.

Mr Burns Ltd c. Show that the marginal product of labour is equal to 𝑧𝐾‾. Does it satisfy the assumptions seen in the course? (Hint: you can use derivatives, or you can calculate the change in output if we increase the amount of N by one unit)

A

The marginal product of labour is equal to 𝑀𝑃𝑁 = 𝑧𝐾‾ (𝑁 + 1) βˆ’ 𝑧𝐾‾𝑁 = 𝑧k

or you would do the partial derative with respect to N

The marginal product of labour is therefore constant, and not decreasing

76
Q

Springfield The city of Springfield exists only for one season, after which the show is cancelled and there is no Springfield anymore. Consumers are all identical, hence we will look at the representative consumer of this economy: Homer Simpson. There is only one firm, Mr Burns Ltd, which produces donuts with labour and capital. Capital is fixed, and given. The production function is given by

π‘Œ = 𝑧𝐾‾𝑁

Homer thinks of consumption and leisure as perfect substitutes. Hence, his indifference curves can be represented as

𝑒 = π‘Žπ‘™ + 𝑏𝐢 where π‘Ž and 𝑏 are positive constants, 𝐢 is consumption (donuts), 𝑙 is leisure (watching TV), and 𝑒 is a generic level of happiness for Homer. In other words, indifference curves are straight lines. By increasing 𝑒, we can draw indifference curves that make Homer happier.

Homer has a maximum number of hours per day equal to β„Žβ€Ύ, he works for a wage 𝑀, and owns (as does every other consumer in Springfield) a share of Mr Burns Ltd. Assume that dividends πœ‹ = 0. The Springfield Mayor is on holiday, so 𝐺 = 0.

Draw the diagram of the production possibilities frontier.

A
77
Q

Springfield The city of Springfield exists only for one season, after which the show is cancelled and there is no Springfield anymore. Consumers are all identical, hence we will look at the representative consumer of this economy: Homer Simpson. There is only one firm, Mr Burns Ltd, which produces donuts with labour and capital. Capital is fixed, and given. The production function is given by

π‘Œ = 𝑧𝐾‾𝑁

Homer thinks of consumption and leisure as perfect substitutes. Hence, his indifference curves can be represented as

𝑒 = π‘Žπ‘™ + 𝑏𝐢 where π‘Ž and 𝑏 are positive constants, 𝐢 is consumption (donuts), 𝑙 is leisure (watching TV), and 𝑒 is a generic level of happiness for Homer. In other words, indifference curves are straight lines. By increasing 𝑒, we can draw indifference curves that make Homer happier.

Homer has a maximum number of hours per day equal to β„Žβ€Ύ, he works for a wage 𝑀, and owns (as does every other consumer in Springfield) a share of Mr Burns Ltd. Assume that dividends πœ‹ = 0. The Springfield Mayor is on holiday, so 𝐺 = 0.

The mayor of Springfield comes back from his holiday in the Quimby Compound, bringing one of his crazy ideas: he wants to build a totally useless school for teaching how to play poker. The cost of the school is 𝐺, which will be paid by Springfield’s citizens with lump sum taxes 𝑇. Assume 𝐺 is large enough that we never have a situation for which πœ‹ > 𝑇.

Define the competitive equilibrium. Assume that 𝑧 = 𝐾‾ = 1, π‘Ž = 2 and 𝑏 = 3. Find the Pareto optimal allocation. (Fast and Smart)

A

C = -wl + wh + n - T

C = WN^s + n - T

y = zkl G=T

Y = I = h - Nd = Nd = h -y

in equibrium

Ns = Nd = N

C = w(h - y) + (n - G) n n = 0

C = w (h bar - l - G

C = wh - wl - G

78
Q

Springfield The city of Springfield exists only for one season, after which the show is cancelled and there is no Springfield anymore. Consumers are all identical, hence we will look at the representative consumer of this economy: Homer Simpson. There is only one firm, Mr Burns Ltd, which produces donuts with labour and capital. Capital is fixed, and given. The production function is given by

π‘Œ = 𝑧𝐾‾𝑁

Homer thinks of consumption and leisure as perfect substitutes. Hence, his indifference curves can be represented as

𝑒 = π‘Žπ‘™ + 𝑏𝐢 where π‘Ž and 𝑏 are positive constants, 𝐢 is consumption (donuts), 𝑙 is leisure (watching TV), and 𝑒 is a generic level of happiness for Homer. In other words, indifference curves are straight lines. By increasing 𝑒, we can draw indifference curves that make Homer happier.

Homer has a maximum number of hours per day equal to β„Žβ€Ύ, he works for a wage 𝑀, and owns (as does every other consumer in Springfield) a share of Mr Burns Ltd. Assume that dividends πœ‹ = 0. The Springfield Mayor is on holiday, so 𝐺 = 0.

The mayor of Springfield comes back from his holiday in the Quimby Compound, bringing one of his crazy ideas: he wants to build a totally useless school for teaching how to play poker. The cost of the school is 𝐺, which will be paid by Springfield’s citizens with lump sum taxes 𝑇. Assume 𝐺 is large enough that we never have a situation for which πœ‹ > 𝑇.

Pareto optimal allocation. (Fast and Smart) f. Can you suggest a competitive equilibrium (i.e. a value for the real wage 𝑀) that implements the Pareto optimal allocation? Explain why or why not.

A

We need to find a real wage 𝑀 for which the competitive equilibrium defined in (e) delivers the Pareto optimal allocation. We can do this since this economy has no market imperfections and therefore first and second welfare theorems hold. A real wage 𝑀 = 1 implements the Pareto optimal allocation. To see why, notice that in (b) we have seen that for a real wage 𝑀 > π‘Ž/ 𝑏 , Homer’s optimal choice is work all day and consume as many donuts as he can afford. Also notice that if 𝑀 < 𝑧𝐾‾, then Mr Burns Ltd makes an extra marginal profit on each additional worker it hires, hence it will want to hire as many workers as possible. If 𝑀 > 𝑧𝐾‾, then each worker hired implies a loss, hence Mr Burns Ltd does not want to hire anyone. If 𝑀 = 𝑧𝐾‾ = 1, then Mr Burns Ltd is indifferent between any quantity of workers hired, as it gives always the same profit of zero. Hence, if 𝑀 = 1 the labour market clears, as Homer wants to work all day, and Mr Burns Ltd is indifferent with respect to how many workers should be hired, so any number is fine.

79
Q

The zombie apocalypse just started but it is not looking good, and everybody knows that this is the last year before the zombies take over the world. Everybody is acting as if the world will end next year. Mark all the correct answers.

Select one or more:

a. Zombies destroy part of the capital of the country. In a competitive equilibrium, this reduces the labour supply for sure.
b. Zombies destroy part of the capital of the country. In a competitive equilibrium, this increases the labour supply for sure.
c. Zombies destroy part of the capital of the country. In a competitive equilibrium, this increases consumption for sure.
d. Zombies destroy part of the capital of the country. In a competitive equilibrium, this decreases consumption for sure.
e. Zombies destroy part of the capital of the country. In a competitive equilibrium, labour supply may go up, down or stay the same.

A

The effect of a reduction in the capital stock is similar to a reduction of the TFP

Intuitively, each worker on average has a lower amount of machines to work it, hence it can produce less. Hence there are substitution and income effects.

The the income and subsitution effect for lesuire goes in opposite directions, so we cant tell whether labour supply goes up or down ( if the income effect is higher then labour supply goes up, but if subisituiton effect is greater then labour supply falls)

Consumption for the income and subistution effect both go in the same direction, downwards, so we know for sure.

80
Q

28 Days Later, you wake up in the Guy and St. Thomas Hospital in London, completely empty, and half destroyed. You are not really sure what happened. You meet some people that explain to you the city has been overrun by zombies. The society is still working so far, but we are now bartering (as money is worthless). All the shares you owned before are now worthless and pay zero dividends. The government is not able to collect taxes, so you don’t pay any. You spend your time in three ways: working (N^s), watching out for zombies (Z) or relaxing (l), with a total amount of hours equal to h β€Ύ. Assume that you watch for zombies a constant amount of hours (Z=Z β€Ύ>0) and you cannot change this. If you work, you are paid a real wage w, which is the same than before the zombies showed up. Before the apocalypse, you didn’t need to watch out for zombies and therefore Z=0 back then.

Select one or more:

a. Your optimal choice for consumption will now be lower than before the zombie apocalypse
b. Your optimal choice for consumption will be higher than before the zombie apocalypse
c. You will work more than before the zombie apocalypse
d. You will work less than before the zombie apocalypse

A

Since you now have to watch out for zombies, your total amount of time for work and leisure has been reduced from β„Žβ€Ύ to β„Žβ€Ύ βˆ’ 𝑍‾. The budget constraint moves to the left in a parallel fashion, with new vertical intercept equal to 𝑀(β„Žβ€Ύ βˆ’ 𝑍‾) and new horizontal intercept equal to β„Žβ€Ύ βˆ’ 𝑍‾. Since both consumption and leisure are normal goods, both of them will be reduced in the new optimal choice. Hence, you will consume less. Hours worked also will decrease: since πœ‹ βˆ’ 𝑇 = 0, then 𝐢 = 𝑀𝑁 𝑠 , and as consumption goes down it must be that also hours worked have gone down. The reduction in total hours that can be dedicated to work or leisure has therefore reduced both. Hence (a) and (d) are correct.

81
Q

28 Weeks later, after months of quarantine, the United Kingdom has been finally freed from zombies. You were evacuated early on in the apocalypse, staying in Paris during the period in which the UK was quarantined, and you can now return to London. Everybody knows the zombies are going to come back soon, hence the general feeling is that this is something that can last one year, then you will be evacuated again. Life is back to normal, although we still have to barter. You work for a wage w. In London the government spending G is down with respect to before the apocalypse, as the government is struggling to collect taxes.

Select one or more:

a. Your optimal choice for consumption will now be lower than before the zombie apocalypse
b. higher Your optimal choice for consumption will be higher than before the zombie apocalypse
c. higher You will work more than before the zombie apocalypse
d. higher You will work less than before the zombie apocalypse

A

If G is down, taxes are lower. Hence, your budget constraint moves outwards without changing slope. Since we were in a situation with πœ‹ βˆ’ 𝑇 = 0 before the zombie apocalypse, we now will have that πœ‹ βˆ’ 𝑇 > 0 and the budget constraint will exhibit a kink at β„ŽΜ…. Taxes go down from 𝑇0 to 𝑇1. There is a pure positive income effect, which implies more consumption and more leisure as they are both normal goods. You will therefore consume more, and work less than before the zombie apocalypse. (b) and (d) are correct

82
Q
A