what is the schedule
- the project’s time plan
- derived from the WBS
- organises activities into their time sequence
- takes account of dependencies
- highlights critical activities and milestones
what is the process of scheduling?
- take activities defined in WBS
- estimate durations
- work out dependencies for each activity
- develop the network
- calculate total duration of project, critical path and float
what is a network?
- visual representation of project
- shows interdependencies
- shows critical path
- identifies float
- AON convention (activity on node)
what is float
float - the about of time by which non-critical activities can be delayed without affecting the project’s completion date
critical path
those activities which, if delayed, would delay the whole project activities on the critical path have zero float
AON networks
activity on node network activities are shown as (boxes) nodes which are connected, showing dependencies using arrows
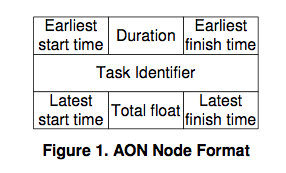
Draw node format
How do you calculate duration of project?
- Forward pass through network
- use earliest start time (EST) and earliest finish time (EFT) for each activity
- EST is the same as the EFT for the preceding activity
- EFT = EST +D
- The Duration is the EFT of the final activity
How do you calculate float?
- Backward pass through network
- establishes latest start time (LST) and latest finish times (LFT) of each activity
- LST = LFT-D
- Float = LST- EST or LFT-EFT
- LFT = LST of successor
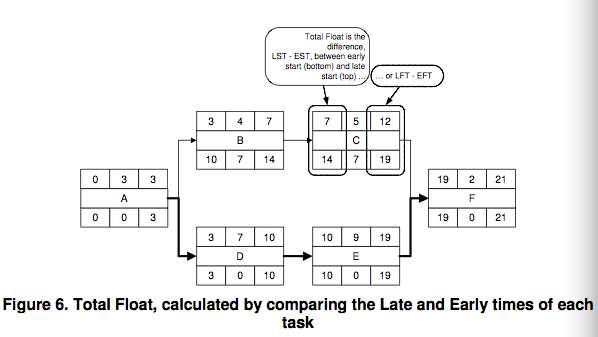
How do you calculate total float?
difference between the LST for an activity and its EST
i.e. - on node either the difference between first top and bottom or last top and bottom number
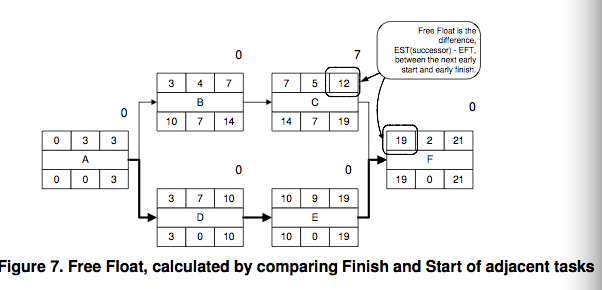
what is free float?
the amount of time by which an activity can be delayed without affecting the earliest start time of any sucessor activity
free float = EST (of earliest successor) - EFT
free float is denoted at the top right hand side of each node pic
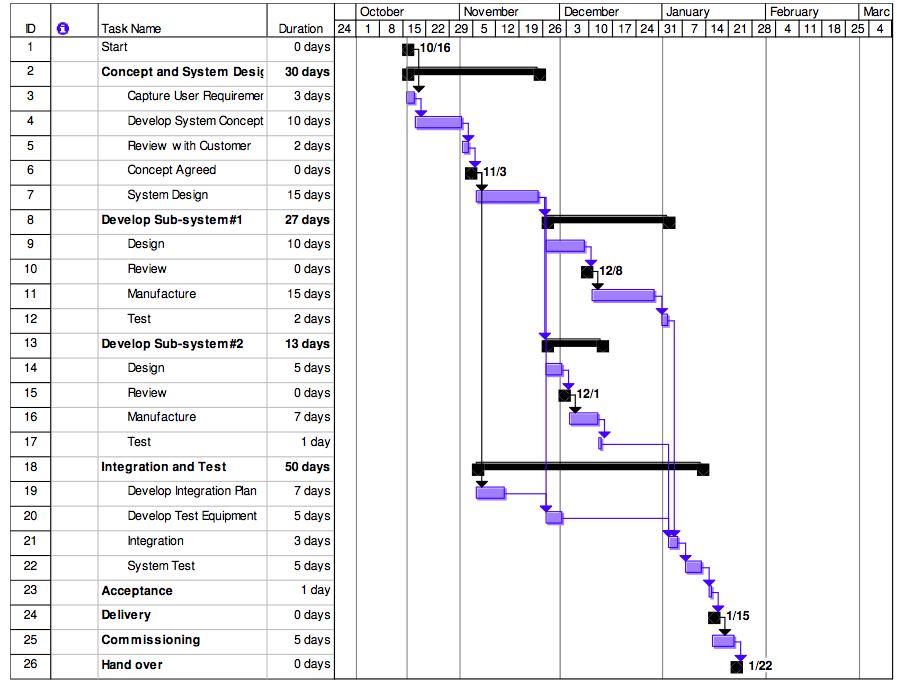
what is a gantt chart?
bar chart representation of the network
horizontal rows represent activities
task dependencies linked by arrows
advantages of gantt chart
- resource histogram uses the same axis
- easy to read overview of project
- dependencies can be shown
- progress-tracking can be used
disadvantages of gantt chart
dependencies not as apparent as in the network diagram can become confusing
What are lags?
- time delay between activity ending and another starting.
- e.g. paint left to dry before second coat
- represented in network as a node labelled ‘lag’ and duration or on bar chart in the same way
what is crashing?
the reduction of the critical path, however there will be a cost associated with this.
(overtime labour, additional equipment)
schedule crashing considers the lowest cost option for reducing the critical path
*How do you do crashing analysis?
- estimate cost of critical path activities at normal duration
- estimate cost of activities at reduced duration (crashed) - note that some activities cannot be crashed at all
- calculate incremental cost (per day/week saved) for each crashed activity - cost/time slope
- rank
- select a set of activities, at the lowest cost/time slope to be crashed
What criteria would you use for re-seceduling activities?
Cannot re-schedule tasks on the critical path – as this will adversely impact the project completion date.
• Tasks with free float first, tasks can be moved within their free float without adversely affecting the EST of successor activities.
• Tasks with total float next, as these can be moved without affecting the project completion date.
• Consider which tasks would cause least disruption or difficulty to re-schedule, for example – go for small, easy tasks first.
• The context of the network as a whole, aim to met the resource requirements but whilst retaining as much float as possible within the network.
-
Project characteristics and measuring success19
-
Project Planning11
-
Why Projects Fail17
-
Defining the work budget17
-
Project proposals11
-
Scheduling18
-
Managing stakeholders14
-
Resource Management17
-
Earned Value24
-
Teamwork11
-
Risk management22
-
Monitoring and Control8
-
Projects within organisations13
-
Motivation and leadership20
-
Configuration and Change Control13
-
negotiation and contracts7
-
Quality Management14
-
Project closure6
