Reading 7: Statistical Concepts and Market Returns Flashcards
Holding Period Return Formula
7.1
Statistical Concepts and Market Returns
Where:
Pt = price per share at the end of time period t
Pt-1 = price per share at the end of time period t-1, the time period immidiately preceding time period t
Dt = cash distributions received during time period t

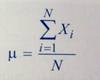
Population Mean Formula
7.2
Statistical Concepts and Market Returns
Where:
N is the number of observations in the entire population and Xi is the ith observation.
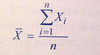
Sample Mean Formula
7.3
Statistical Concepts and Market Returns
Where:
n is the number of observations in the sample.
Weighted Mean Formula
7.4
Statistical Concepts and Market Returns
Where:
the sum of the weights equals 1.

Geometric Mean Formula
7.5
Statistical Concepts and Market Returns
G is a set of observations X1, X2, …, Xn
In investments, we frequently use the geometric mean to average a time series of rates of return on an asset or portfolio, or to compute the growth rate of a fincancial variable such as earnings or sales.

Geometric Mean Return Formula
7.6
Statistical Concepts and Market Returns
Given a time series of holding period returns Rt, t = 1,2, …, T, RG is the geometric mean return over the time period spanned by the returns R1 through Rt

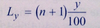
Position of a Percentile Formula
7.7
Statistical Concepts and Market Returns
Given Py, which is the value at or below which y percent of the distribution lies, or the yth percentile.
Where y is the percentage point at which we are dividing the distribution and Ly is the location (L) of the percentile (Py) in the array sorted in ascending order.
Position of a Percentile Formula
7.8
Statistical Concepts and Market Returns
Given Py, which is the value at or below which y percent of the distribution lies, or the yth percentile.
Where y is the percentage point at which we are dividing the distribution and Ly is the location (L) of the percentile (Py) in the array sorted in ascending order.

Range Formula
7.9
Statistical Concepts and Market Returns

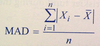
Mean Absolute Deviation
7.10
Statistical Concepts and Market Returns
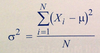
Population Variance
7.11
Statistical Concepts and Market Returns
Population Standard Deviation
7.12
Statistical Concepts and Market Returns

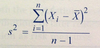
Sample Variance
7.13
Statistical Concepts and Market Returns
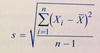
Sample Standard Deviation
7.14
Statistical Concepts and Market Returns
Coefficient of Variation
7.15
Statistical Concepts and Market Returns

Sharpe Ratio
7.16
Statistical Concepts and Market Returns
Where:
Rp is the mean return to the portfolio, and Rf is the mean return to a risk-free asset, and sp is the standard deviation of return on the portfolio.
NOTE: The RF-RP [both bar…too hard to write] term measures the extra reward that investors receive for the added risk taken. This difference is called the mean excess return on portfolio p.
Thus, the Sharpe ratio measures the reward, in terms of mean excess return, per unit of risk, as measured by standard deviation of return. Those risk-averse investors who make decisions only in terms of mean return and standard deviation of return prefer portfolios with larger Sharpe ratios to those with smaller Sharpe ratios.

Sample Skewness Formula
7.17
Statistical Concepts and Market Returns
Where n is the number of observations in the sample and s is the sample standard-deviation.

Sample Excess Kurtosis Formula
7.18
Statistical Concepts and Market Returns
Where:
n is the sample size and s is the sample standard deviation.

Geometric Mean w/ Natural Logarithms
7.xtra
Statistical Concepts and Market Returns

Semivariance Formula approximating the unbiased estimator
7.xtra
Statistical Concepts and Market Returns

Target Semivariance Formula
7.xtra
Statistical Concepts and Market Returns

Chebyshev’s Inequality
7.xtra
Statistical Concepts and Market Returns

Proportions from Chebyshev’s Inequality
7.xtra
Statistical Concepts and Market Returns

