Quantitative Methods Flashcards
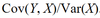
r
r = Cov(X, Y) / sX sY
r (extended)

spurious correlation
- Correlation between two variables that reflects chance relationships in a particular data set
- Correlation induced by a calculation that mixes each of two variables with a third
- Correlation between two variables arising not from a direct relation between them but from their relation to a third variable
CFO
NI + non cash charges - working capital investement
Assumptions of the linear regression model
- The relationship between the dependent variable, Y, and the independent variable, X is linear in the parameters b0 and b1. This requirement means that b0 and b1 are raised to the first power only and that neither b0 nor b1 is multiplied or divided by another regression parameter (as in b0/b1, for example). The requirement does not exclude X from being raised to a power other than 1
- The independent variable, X, is not random
- The expected value of the error term is 0: E(ε) = 0
- The variance of the error term is the same for all observations: E(ε2i)=σ2ε , i = 1, …, n
- The error term, ε, is uncorrelated across observations. Consequently, E(εiεj) = 0 for all i not equal to j
- The error term, ε, is normally distributed
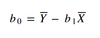
b0
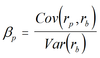
b1
FFCF
CFO + Interest expense (1 - t) - FCInv
/
NI + non cash charges - WCInv + Interest expense (1 - t) - FCInv
t-test for the correlation coefficient

Least square equation

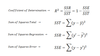
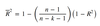
Coefficient of determination
r2
/
1 - (unexplained variation/ total variation)
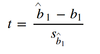
t-test for linear regression
t-test for linear regression - utility
For hypothesis tests concerning the population mean of a normally distributed population with unknown (known) variance, the theoretically correct test statistic is the t-statistic (z-statistic). In the unknown variance case, given large samples (generally, samples of 30 or more observations), the z-statistic may be used in place of the t-statistic because of the force of the central limit theorem
t-test for linear regression - degrees of freedom
of observations - (Number of independant variables + 1) =
n - (k + 1)
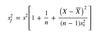
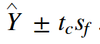
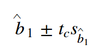
t-test for linear regression - interval
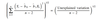
SEE
(SSE/n-2)1/2
SEE - relation to unexplained variation
Unexplained variation = SSE
SEE - definition
The standard error of the estimate is a measure of the accuracy of predictions made with a regression line. (Also called the residual standard error)
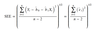
SE of the t-test for linear regression

Standard error versus standard deviation
The standard error of the sample is an estimate of how far the sample mean is likely to be from the population mean, whereas the standard deviation of the sample is the degree to which individuals within the sample differ from the sample mean
Type I error : rejecting a true null hypothesis
Type II error : failing to reject a false null hypothesis
p-value definition
Smallest level of significance at which the null hypothesis can be rejected
EV
Market value of equity and debt - value of cash and investments
IC (Invested Capital)
Book value of debt and equity