Quantitative Methods Flashcards
In linear regression what is the confidence interval for the Y value
CI = Y +/- (tcritical) x (SE forecast)
What does the t-test evaluate
Statistical significance of an individual parameter in the regression
What does the F-test evaluate
The effectiveness of the complete model to explain Y
Is the dependent variable X or Y in a linear regression
Y
Explain what it means to say a “critical t-stat is distributed with n-k-1 degrees of freedom”
This is the t value that is compared with the measurements of the data.
The t-critical is taken from the standard table for the n and significance level.
What expression does the line of best fit for a linear regression minimise
Sum of the squared errors between Y theoretical and Y estimated.
What is the SSE of a linear regression
Sum of the squared residuals
Sum of the squared errors between Y theoretical and Y estimated.
What is the first of six classic normal linear regression assumptions, concerning parameter independence
- The relationship between Y and X is linear for the parameters and:
(1a) -the parameters are not raised to powers other than 1 and
(1b) - are parameters are separate and not functions of other parameters. - X can be powers other than 1
What is the second of six classic normal linear regression assumptions, concerning X, the independent variable
X is NOT RANDOM
X is not correlated with the Residuals
(note that Y can be correlated with the residuals)
Describe the relationship between “total variation of dependent variable” and “explained variation of dependent variable”
It is the change in observed value of Y for a change in value of X
Vis a vis the
Expected change in Y given the regression model
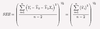
Explain covariance X and Y
Its the sum of the cross products of the difference from the mean of X and Y
Divided by n-1
Cov(X,Y)=(X-Xmean)(Y-Ymean)/(n-1)
What is the correlation coefficient of X,Y
Its the Cov(X,Y) divided by the product of sqrt(sum deviations of X from X_mean) and sqrt(sum deviations of Y from Y_mean)
For the error term of a linear regression what are the assumptions concerning correlation and variance
- Errors are uncorrelated
- Variance is the same for any observation
What 3 criteria must be satisfied for sample correlation coefficient to be valid
- Mean and Variance of X and Y are finite and constant
- The covariance between X and Y is finite and constant
Re Correl=cov(X,Y)/(sX.sY)
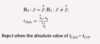
What is the t-staristic compared with?
How is it calculated
t statistic is compared with t-critical from tables
t-stat =
(b1 measured - value of b1 theoretical given null hypothesis) / (SE of b1 measured)
When b1 theoretical = 0 t=(b1_est / SE b1_est)
What is the similarity of an F-test with a t test in a simple regression
F-test = t-test of the slope coefficient
Define “dependent variable”
The variable Y whose variation is explained by the independent variable, X.
Give three other names for the dependent variable.
Explained variable
Endogenous variable
Predicted variable
Define the “Independant variable”
The variable used to explain the dependent variable.
Give three other names for the Independent variable.
Explanatory variable
Exogenous variable
Predicting variable
What is the second of six classic normal linear regression assumptions, concerning the Independent variable and the residuals
The independent variable X is uncorrelated with the residuals
(note Y can be correlated with the residuals)
X must not be random
What is the third of six classic normal linear regression assumptions, concerning the expected value of the residual
The expected value of the residual=zero
[E(ε) = 0].
What is the fourth of six classic normal linear regression assumptions, concerning the variance of the residual
The variance of the residual is constant for all values of residual
Homoskedasticity.
NO HETEROSKEDASTICITY .e.g where residuals change and get more or less noisy
What is the fifth of six classic normal linear regression assumptions, concerning the distribution of residual values
The Residuals are not correlated with each other (this means they are independently distributed)
e.g. NO SERIEL CORRELATION
What is the sixth of six classic normal linear regression assumptions, concerning the distribution of residual values
The distribution of the residuals is a normal distribution (with mean zero?)
Explain what the slope b1 is for a simple linear regression?
What is the expression for this slope coefficient in terms of variation of X and Y?
It is the change in Y due to a 1 unit change in X
b1=cov(X,Y)/var(X)
From a simple linear regression
Express the intercept b0
Express the slope b1
Y=b0 + b1.X
b0 = Y_mean - b1.X_mean
b1 is the slope =
Cov(X,Y)/Var(X)
What is the covariance of x with itself, Cov(X,X)
Var (X)
For the SSE and the SEE
- What is the same?
- What is different?
- “E” is error of the estimate = residual
SEE is a function of SSE - Sum of squares vs standard deviation
SSE uses the sum of the squared residuals
SEE uses the standard deviation of the residuals = sqrt[(SSE)/(n-2)].
What does SEE guage?
Give two other names for this
Fit of the linear regression:
- Standard deviation of the residuals (the standardized error)
- Standard Error of the regression
For what type of regression will SEE be low
For a good fit, strong relationship between the Y and X variables
The standars deviation of the residuals will be low
For what type of regression will SEE be high
Low fit, weak relationship between variables X and Y
This means standard deviation of residuals will be high
What does the coefficient of variation show
R squared
(Variation of X)/(Variation of Y)
Describe sample Covariance
Covariance (X,Y) = Sum (X- Xmean)(Y- Ymean)/(n-1)
Describe sample variance
Sample Variance (X) =[Sum (X- Xmean)squared /(n-1)]
Which three conditions are necessary for valid correlation coefficient
- Mean of X and Y is finite and constant
- Variance of X and Y is finite and constant
- Covariance (X,Y) must be finite and constant
How is SEE calculated
Standard deviation of residuals
sqrt [SSE/(n-2)]
What is R squared?
What does it mean?
Coefficient of determination.
It is the explained variation by percentage of total variation of the Dependent variable. It is % of total variation that is explained by the independent variables
R2
Squared = 65% means (variation X) /(variation of Y) = 0.65
How can R squared quickly be calculated for a simple linear regression with one independent variable?
R squared= r (correlation x,y) squared
What does the confidence interval of a regression coefficient show?
What is the test based on?
Whether the coefficient is statistically significant or not.
The test is based upon the coefficient not being zero, being “statistically different from zero”
If coefficient is zero that variable should not be in the regression because it is unrelated to Y.
How to show a coefficient is statistically different from Zero.
Explain how 95% confidence interval is calculated and used to test for null hypothesis of a slope coefficient bi from 35 samples
bi +/- (t_crit × SE_bi)
t_crit is obtained from student t where
Two tailed significance = 0.05
df = 35-2 = 33
Zero must fall within the range to confirm the null hypothesis otherwise
bi is statistically not zero
How to show the true value of a coefficient is not Zero and that X explains Y
Explain how 95% confidence interval is calculated and used to test for null hypothesis of a slope coefficient bi from 36 samples
Compare estimated b1 with hypothetical b1=0
Null hypothesis is b1=0
Test is t is outside range=
- t_critical to + t_critical
t_b1 < - t_crit
t_b1 > + t_crit
t_b1= (b1-0)/(SE b1)
t_crit =
df=36-2
Sig= 0.05
What is the df for error terms relative to number of observations for:
- Parameter estimate
- Predicted Y
For both the degree of freedom is adjusted for the number of parameters = number of coefficients plus intercept.
df = (n-2)
What is the null and alternative hypothesis for intercept term, b0
Hnull: b0=0
Ha: b0<>0
Explain R squared as function of explained, unexplained and total variation
R_squared = (explained variation) / (total variation)
= RSS/SST
R_squared = (Total variation - Unexplained variation) / (total variation)
=(SST-SSE)/SST
R_squared
=1-(unexplained/total)
= 1-(SSE/SST)
Describe SSE
The SSE is the sum of all the Unexplained Variation
Sum of all the squared residuals (Y actual - Y predicted)
Describe the Total Variation
How else is it known?
This is the sum of all squared differences between actual Y and mean( of all Y) = (Y actual - Y mean)
SST
= explained (RSS) + unexplained (SSE)
Describe the explained variation
What else is it called?
This is the sum of the squared differences of predicted Y from mean of Y
Sum (Y_predicted -Y_mean)
RSS = Regression explained variation
How does the slope coefficient explain correlation between two variables
It does not. This is a trick question
Explain how to calculate CI around a predicted Y
CI pred Y
= pred Y +/-
(Sf x t_crit)
Two tailed because its either side of pred Y
Sf is Standard Error of the Forecast Pred Y
If the standard error of predicted Y is not given what 3 values needed to calculate it
- n observations
- SEE (standard deviation of residuals)
- Variance and mean of X
- Xi for Predicted Y
Derive sf (standard error of forecast Y) using all of
- SEE,
- variance X
- Xi
- X mean
(Sf) squared =
SEE squared x [1+ 1/n + (Xi-X mean) squared /((n-1)× variance(X))]
Derive total variation of Y from
Unexplained + Explained
- Explained = variation of Y pred around mean Y
- Unexplained = variation of actual Y around Y pred
Input formula 1 + 2 from above
What is RSS
Regression Sum of Squares
The variation explained by the regression model
(Y pred-Ymean) squared
What is SSE
This sum of the squared residuals
The part of the regression model that cannot explain the part of total variation Yi from Y mean (this is the part not explained by RSS)
(Yactual - Ypred) squared
SSE=(MSE)x (n-k-1)
What is SST
It is the total variation of Y actual from Y mean
(Yactual - Ymean) squared
SST= RSS + SSE
Calculate and interpret the standard error of the estimate (SEE).
SEE indicates certainty about predictions using the regression equation
It is the standard deviation of the SSE, the “sum of the squared residuals”

Calculate and interpret the coefficient of determination (R2).
R2 indicates confidence about estimates using the regression
It is the ratio of the variation “explained” by the model over the “total variation” of the observations against their mean (the variation due to the distribution of all the observations)

Describe the confidence interval for a regression coefficient, b1 pred
It is a range values either side of the estimated coefficient, b1
C.I. = b1pred +/- (t_crit x standard error of b1 pred)
Formulate a null and alternative hypothesis about a population value of a regression coefficient and determine the appropriate test statistic and whether to reject the null hypothesis.

What part of the model effectiveness does F test determine
The effectiveness of the group of k independent variables
Explain MSE What is the adjusted sample size Explain SEE
MSE= The sample mean of Squared residuals The adjusted sample size = n-k-1 SEE = Standard deviation of all the sampled residuals Standard deviation of residuals = sqrt (MSE) SEE = sqrt (MSE) S
What does a large F indicate
Good explanation power
Why is F stat not often used for regressions with 1 independent variable?
F stat is the square of the t-stat and the rejection of F critical where F > Fcrit implies the same as the t-test, t> tcrit
Outline limitations of simple linear regression
- Parameter instability 2. Standard 6 assumptions do not hold, particularly presence of heteroskedasticity and autocorrelation. Both concerned with reliability of the residuals. 3. Public knowkedge limitation: widespread understanding causes participants to act in ways that distorts relationships of independent and dependent variables and future use of the regression is compromised. Note multicollinearity is not for simple linear regression because it concerns correlation of variables or functions of variables in a multiple regression.
Compare Rsquared with F in terms of variation
Rsquared = explained/total variation F = Explained/Unexplained variation
Explain multiple regression Null Hypothesis and Alternative hypothesis How is this tested?
If F test > F crit reject Null Hypothesis. If F test > F crit. At least one slope coefficient is non zero Null is that all slope coefficients = zero Alternative, at least 1 slope coefficient is not zero
Explain adjusted R squared
R squared adjusted = 1 - (df TSS / df SSE)(1-R squared) As k increases df SSE decreases As k increases df TSS does not change As k increases (df TSS / df SSE) increases As k increases adj R squared decreases
What are the drawbacks of multiple R squared
Ggg
Can adj Rsquared be negative
Yes
Compare in 4 key points Rsquared with adjusted R squared
- Adj R squared always <= R squared
- R squared is always greater than adj R squared when k>0
- As k increases, adjusted R-squared increases but then begins to decrease
- Where k=3 adjusted R squared is often max
Explain how dummy variables are evaluated by formulating the Hypothesis
- The omitted dummy variable is the reference class (remember Q4 not included in the regression equation example) so its implicit in the b0 which is always in the output.
- The hypothesis test applied to included dummy variables is whether or not they are statistically different to the reference class (in this case Q4)
- The slope coefficient for each included Dummy gives an output from the regression that represents a function of the included Dummy and the omitted dummy
- So for Ho: b1=0 this means bo=bo+[b1-bo), therefore the Ho tests if b1=bo
- Ha: b1 <>0 this means b1<>bo
If we accept Ho (t-test<= t_crit) this means b1=bo, e.g. Q1 equals Q4 (omitted dummy)
Which test does conditional heteroskedasticity make unreliable
F-test
What are the two types of serial correlation
Positive Negative
What effects result from multicollinearity
Slope coefficients unreliable
Standard Error of slope coefficients b_se, is higher than it should be
t-test is lower than it should be (b / b_se)
less likely to reject null hypothesis that (b=0) since t-test > t_crit
increase in Type II error
How do we detect multicollinearity
If the individual statistical significance of each slope coefficient is low but the F test and R squared indicated high significance then this is classic multicollinearity
How do we correct for multicollinearity
Stepwise regression elimination of variables to minimise multicollinearity
Give 7 types of model misspecification
What is Unconditional Heteroskedasticity
Heteroskedasticity is the opposite of homoskedasticity (the level of variance of the residual is constant across all values of the independent variables)
Unconditional Heteroskedasticity is where the variance of the residuals has no pattern or relation to the level of the independent variable.
It does not cause a significant problem for the regression
What is Conditional Heteroskedasticity?
The variance of the residual is related to the level (value) of the X variables.
Heteroskedasticity is the opposite of homoskedasticity (the level of variance of the residual is constant across all values of the independent variables)
Instead, with Conditional Heteroskedasticity, the variance of the residuals is linked to the values of the independent variables and is NOT constant.
For example variance of residuals could increase as the value of independent variables increase.
It does cause significant problems for a regression
When is an AR(1) model a random walk
When bo = 0 And b1=1
So for AR(1) Xt = bo + b1 Xt-1 + disturbance
AR(1) becomes
Xt = Xt-1 + disturbance
Discuss the mean-reverting level of a random walk
The mean-reverting level is = bo/(1-b1)
for a random walk, b0=0, b1=1
and the mean reverting level = b0/(1-b1)
= 0/0 = “undefined”.
Give 7 assumptions for a multiple regression to be valid
- There must be a linear relationship between the dependent variable and the independent variables
- Independent variables are not random
- There is no linear relationship between the independent variables (e.g. one is not merely a function of the other)
- The expected value of the error term is zero
- The variance of the error term is constant
- The error terms are not correlated with each other
- The error terms are normally distributed
What can cause heteroskedasticity?
When some samples are spread out more than others the variance of the residual changes.
What are the implications of a random walk
The mean reverting level is undefined, unbound 0/0 So mean and variance grows with time. Violating both sinple and multiple regression assumptions. Mean reverting level, Xt=b0/(1-beta1) And Beta1=1, this means the time series has a unit root
Explain any t-test formulation in terms of estimated and hypothetical values
t = (estimated value - hypothetical value (or actual value)) / (standard error of the estimated variable)
standard error is the risk of the estimate being different to the actual value which is equal to the standard deviation of the error between the estimate and the actual value.
This is why things that affect the residual also affect the validity of the coefficient estimates.
What is Beta 1 in a random walk?
Its the lag coefficient
What type of errors are used for heteroskedasticity only
White corrected errors
What type of errors are used for conditional heteroskedasticity and with seriel correlation
Hanson-White
What dies generalized least squares attempt to correct
Conditional Heteroskedasticity
What part of the regression does multicollinearity not affect
The slope coefficients themselves
Discuss Hypothesis rationale
To prove that some factor is significant. Formulate as Beta x Factor, where Beta = zero, the factor is zero in the equation. So a null hypothesis that Beta=0 means the factor is insiginificant Rejecting null hypothesis where t>tcrit means Beta is non zero, so factor is significant
What is the practical effect of multicollinearity in hypothesis testing
Standard errors of coefficients is inflated t test is therefore lower than it really is.
t-test statistic is smaller and so less likely to be greater than t crit
Less likely to reject a null hypothesis (that coefficient is not different to zero ho: b=0 and so b is not significant)
So more likely to conclude a variable is not significant when in fact it is significant
This is a type II error
Explain a Type II error
Accepting a variable as insignificant wgen in fact it is significant. eg t test is lower due to artificially high SE
Explain the rationale for detecting multicollinearity
F test and R squared indicate high explanation power but individual coefficients do not. This happens when coefficients are correlated, washing out individual effects but together explaining the model well
Explain what an unbiased estimator is
where the expected value for the parameter is equal to the actual value of the parameter
Explain what a consistent estimator is
A consistent estimator is where the accuracy of the estimate increases as the sample size (n) increases
Compare the problems between simple linear regression and multiple linear regression
Simple linear regression has only one independent variable but the problems are:
- Heteroskedasticity
- Serial Correlations
Multiple linear regression adds the problem of correlation between multiple independent variables:
- Multi-collinearity
Why does conditional heteroskedasticity cause hypothesis testing errors
What type of Error?
- Standard error of the estimates is unreliable.
If SE is lower than it should be
- This means t-test is higher than it should be
- This means more likely to reject the hypothesis that beta is not significant
- This means more likely to consider a coefficient significant when in fact it is not significant
- This is a Type I error. (false positive - incorrectly rejects a true null hypothesis and concludes the beta is significant and not zero)
If SE is higher, since t-test will be lower, so more likely not to reject a false null hypothesis and to accept that beta is not significant.
- This is a Type II error (false negative - incorrectly accepts a false null hypothesis and concludes that beta is not significant, beta=0)
What is the SEE. What is it approximate to. How is it related to MSE How is it related to SSE
SEE is the variation of the predicted Y around the regression line. Appeoximately equal to standard deviation of residuals SEE = sqrt (MSE) SEE = sqrt (SSE/dof) dof= n-k-1
What does rejection of Ho F=0 mean?
Means one of the independent variables has statistically significant explanatory power F > F crit
What is the ship “HMS regression” full of?
3 problems Heteroskedasticity Multicollinearity Serial Correlation
Which 3 problems are violations of the assumptions of multiple regression?
- Conditional Heteroskedasticity 2. Multi collinearity 3. Serial correlation
What is the effect of heteroskedasticity
Conditional is worse because linked to level(values) of X variables F test is unreliable. SE around individual coefficients are unreliable (too large or too small) t stats will be either too large (se too small) causing false rejection of Ho (Type 1) that there is a statistical difference from zero when in truth there is not Or t is too small (se too large), causing false acceptance of Ho no significance (false positive, Type 2)
What are the two types of heteroskedasticity
Unconditional Conditional
What type of hypothesis error is more likely due to conditional heteroskedasticity?
Both Type 1 (reject Ho:b=0, when in reality it is true) and Type 2 (accept Ho: b=0, when in reality it is false)
What is a Type 1 error?
False positive
False accepting difference
False rejecting similarity
Wrongly assume (t-tcrit)>0, positive, when it is not positive.
Wrongly assume t > tcrit
Wrongly reject H0 when it is really true and should be accepted
Wrongly assume there is a significant difference when really there is no significant difference
What is a Type II error?
False-negative
False-accepting similarity
False- rejecting “no difference”
Wrongly assume (t-tcrit)<0, negative
Wrongly assume t < tcrit
Wrongly assume there is no difference (false negative) when really there is a difference
Wrongly accept H0 =X is true when it is really false
Wrongly accepting the “negative hypothesis” when it should be rejected because there is a difference (a positive).
What is the “negative hypothesis”
The null hypothesis
“Not different” to the stated value
What is a false positive?
Type I error
False rejection
Increased probability of rejecting H0 when it should be accepted
Wrongly accepting the positive and wrongly rejecting the negative.
Incorrectly assume there is a difference and the null hypothesis (negative) is wrong when in fact there is no difference and the null hypothesis is true.
Wrongly assume “positive” that (t>tcrit) when it is really false and (tcrit ) “negative” is actually true
Wrongly accepting (t-tcrit)>0 “positive” as true when it is really false and negative
In reality (t-tcrit)≤0 “negative” is true so above is a “false positive”
This leads to (t>tcrit) rejecting the Ho: b=0 when it should instead be accepted.
What is a false negative?
Type II error
False acceptance
Increased probability of accepting H0 when it should be rejected
Accepting (tcrit) as true when it is really false and (t>tcrit ) is actually true
Wrongly accepting (t-tcrit)<0 “negative” as true when it is really false
In reality (t-tcrit)≥0 is true so above is a “false negative”
This leads to accepting the Ho: b=0 (tcrit) when it is false, a false negative.
What is the effect of serial correlation on hypothesis testing
Increased probability of Type 1 errors
What is the effect of Multicollinearity on hypothesis testing
Increased probability of Type II errors
Increased probability of false-negative (tcrit)
Increased probability of accepting H0
What does the Brausch-Pagan test show
Heteroskedasticity
What Rsquared is used in BP test
From a regressio of the squared residuals from the first regression
What is the BP stat equivalent for BP test of conditional heteroskedasticity
- Use Chi-square BP crit 2. One degree of freedom 3. 5% one-tailed test BP test = n x Rsquared (regresssion on squared residuals)
What is condition to reject null hypothesis for conditional heteroskedasticity
BP test > chi-square This rejects Ho no skedasticity and concludea there is conditional heteroskedasticity.
How to correct for conditional heteroskedasticity
Test the regression coefficients using: t_stat= coefficient / White-corrected SE. t crit from t tables with n-k-1 dof
What is the effect of serial correlation on hypothesis testing
- Estimates SE are smaller than actual 2. t stat is therefor larger than reality 3. Type 1 errors are more common (false positive). 4. False positive is where Ho is rejected too often.
What two methods are used to detect serial correlation
- Residual plots 2. Durbin-Watson
Describe DW test
DW=2(1-r) r=correlation between residuals
When is DW=2
When r=0 When there is no serial correlation, r=0
When is DW<2
When r is positive -> serial correlation
When is DW>2
With negative serial correlation
Explain the DW decision rule
Ho: No positive serial correlation
If DW statlower then reject Ho - conclude there is serial correlation
If DW stat> dupper then accept Ho - conclude there is no serial correlation
Inconclusive If dlower< DW stat < dupper
Explain an autoregressive (AR) model.
An AR model regresses against prior periods of its own data series.
We drop notation of yt as the dependent variable and only use xt
A pth- order autoregression, AR(p), for xt is: xt=b0+b1xt−1+b2xt−2+…+bpxt−p
Contrast random walk processes with covariance stationary processes.
Coefficient b1 = 1 (i.e., unit root) implies nonstationarity via mean reversion; therefore, first difference a random walk with drift before using an AR model:
- yt* = xt − xt−1,
- yt* = b0 + εt, b0 ≠ 0
Perform the same differencing operation for any b1 > 1.
Calculate the predicted trend for a linear time series given the coefficients.
The independent variable in a linear trend changes at a constant rate with time:
- yt = b0 + b1t + εt*
- where t = 1, 2, . . . , T*
Why are moving averages generally calculated?
To focus on the underlying trend by eliminating “noise” from a time series.
Describe objectives, steps, and examples of preparing and wrangling data.
Unstructured: Text cleansing
Remove html tags: Most text data from web pages have html markup tags.
Remove punctuations: Most punctuations are unnecessary, but some may be useful for ML training.
Remove numbers: If numbers are in the text, they should be removed or substituted with an annotation /number/.
Remove white spaces: White spaces should be identified and removed to keep the text intact and clean.
Identify the two sources of uncertainty when the regression model is used to make a prediction regarding the value of the dependent variable.
- The uncertainty inherent in the error term, ε.
- The uncertainty in the estimated parameters, b0 and b1.
Calculate and interpret a confidence interval for the predicted value of the dependent variable.
∧Y± tCrit x sf
sf=standard error of the forecast Y
State and explain Step 2 in a data analysis project.
Step 2: Data collection
Data collection
Sourcing internal and external data;
Structuring the data in columns and rows for (Excel) tabular format.
What is the OBJECTIVE of model training.
The objective of model training is to minimize forecasting errors:
Explain Method Selection in model training
Method selection involves deciding which ML method(s) to use based on the classification task and type and size of data.
Explain Performance Evaluation in model training
Performance evaluation uses complementary techniques to quantify and understand model performance.
Explain Tuning in model training
Tuning seeks to improve model performance.
Describe preparing, wrangling, and exploring text-based data for financial forecasting.
A corpus is any collection of raw text data, which can be organized into a table containing two columns.
The two columns are:
- (sentence) for text and
- (sentiment) is for the corresponding sentiment class.
The separator character (@) splits the data into text and sentiment class columns
Describe the two ways to determine whether a time series is covariance stationary.
- Examine for statistically significant autocorrelation for any residual.
- Conduct the Dickey-Fuller test for unit root (preferred approach).
Describe objectives, methods, and examples of data exploration.
Feature engineering
Numbers are converted into a token such as “/number/.”
N-grams are discriminative multi-word patterns with their connection kept intact. For example, a bigram such as “stock market” treats the two adjacent words as one.
Name entity recognition (NER) algorithm analyzes individual tokens and their surrounding semantics to tag an object class to the token.
Parts of speech (POS) uses language structure and dictionaries to tag every token with a corresponding part of speech. Some common POS tags are nouns, verbs, adjectives, and proper nouns.
How is the out-of-sample forecasting performance of autoregressive models evaluated?
On the basis of their root mean square error (RMSE).
The RMSE for each model under consideration is calculated based on out-of-sample data.
The model with the lowest RMSE has the lowest forecast error and hence carries the most predictive power.
Identify the two ways to correct for serial correlation in the regression residuals.
- Hansen’s method - Adjusts standard errors for the coefficients.
(a) The coefficients stay the same, but the standard errors change.
(b) Robust standard errors for positive correlation are then larger. - Modify the regression equation to eliminate the serial correlation.
What relationship does a linear regression postulate between the dependant and independant variables
It is not causal (but it may be) It is not acausal. It simply postulates a functional, i.e., an associative relationship between them.
What does the coefficient of determination measure
The R-square of the regression, measures the amount of variance of the dependent variable explained by the independent variable.
For a simple linear regression what is the correlation of X with Y given slope b1
= square root of R-squared. The sign, is not given by the R-squared. This is the sign of the slope coefficient.
What is conditional heteroskedasticity
The variance of the residuals is related to the size of the independant variables
What is multi collinearity
Two or more independent variables are correlated with each other
Give 2 effects of multicollinearity
- Too many Type 2 errors Too often accepting Ho 2. Unreliable slope coefficients
What is serial correlation
Correlation of one residual with the next
Give two effects of positive serial correlation
- Too many Type 1 errors 2. Slope coefficients still reliable
What does it mean to say a slope coefficient is unbiased?
When the expected value of the estimate is equal to the true value of the parameter
What are the 2 effects of model misspecifications
- Biased coefficients 2. More Type 2 errors. Cannot rely on hypothesis tests
Deacribe a linear trend model in 4 points
- Uses time as an independent variable 2. Yt=bo + b1(t) + error 3. Plagued by violations, like serial correlation (DW) 4. Appropriate where data points are equally distributed above and below the line with constant mean. E g a mean reverting percent change timeseries. 4.
What is the least likely result of model misspecification
Unbiased coefficients
What are the six types of model misspecification in multiple regression
- Omittimg a variable 2. Not transforming a variable 3. Incorrect data pooling 4. Lagged dependent variable as independent variable 5. Forecasting the past 6. Independent variable that cannot be directly observed and is represented by a proxy with large error
Give two examples of models that have a qualitative dependent variable
- Probit and logit 2. Discriminant
Does misspecification result from using a leading variable from a prior period?
No
Describe using p value to reject Ho
P value < significance level
What is Conditional Heteroskedasticity?
Variance of residual is related to the size of the independent variables
How is conditional heteroskedasticity detected
Breusch-Pagan chi square test 1. Accept Ho (no heteroskedasticity) if BPcrit >= n × R2
When os there conditional heteroskedasticity
When BP (n x R2) > Chi sq crit
What is a consistent estimator
Accuracy of parameter estimate increases as sample size increases
What is the effect of conditional heteroskedasticity
- Too many Type 1 errors (false positive) 2. Rejecting Ho b=0 when it is really true, accepting Ha b>0 when it is really false. 3. Because Standard Errors are underestimated
Why is it harder to reject null under a two-tailed test than under a one tailed test
The rejection region at each side of the distribution is half of the size of the rejection region in a one tailed test
What does covariance tell us
If x and Y move together directly or inversely (positive or negative association)
What does it mean to say coviarance is symetric
The variation of x with y is the same as the variation of y with x Cov(x, y) =Cov(y, x)
What is the covariance of X with itself
Cov(x, x) = var(x)
What are the implications of cov(x, y) =0
r=0 b1=0
Explain sample covariance
- Expected value of x and Y is the mean of x and mean of y the best guess) 2. For each sample the product of the errors of x and Y from the mean of x and y 3. Sum i=1 to n samples (Xi-Xmean) (Yi-Ymean) 4. Divide by n-1 Or Cov (X, Y) = r (sX x sY)
Give two limitations of covariance How are these resolved
- No helpful magnitude of direction can range between negative to positive infinity 2. Only gives direction of relationship + or - 3. Must be standardised by standard deviations of x and y which gives correlation coefficient
What does a linear regression minimise
The sum of the squared residuals Min (SSE)
Draw the SST triangle to obtain SSE and RSS
Insert picture
If SEE goes down does the regression improve or deteriorate
Improves
Give 3 components that make a confidence interval more narrow
- Lower SEE - because SE forecast is dominated by SEE 2. Higher n - because n is in the denominator of a function of SEE 3. If Xforecast is closer to Xmean
Is critical t higher or lower for a two tailed test than a one tailed test
Two tailed test
Is it more or less difficult to reject null hypothesis with a two tailed test or a one tailed test
More difficult to reject with a two tailed test because critical values are higher (the rejection region is split on two sides)
What are the two sources of error in a simple linear regression
Estimate of bo and b1
Write a SLR in log-lin form
Ln Y = bo + b1. X
Write a SLR in lin-log form
Y= bo + b1. ln(X)
Write SLR in log-log form
Ln(Y)= bo + b1. Ln(X)
Describe Ypred in terms of a simple linear regression
Ypred=-(b0 + b1.X1)
Describe an alternative way of calculating SEE using unexplained variation
Unexplained variation = sum of squared residuals = SSE Sqrt[SSE/(n-2)]
How is SEE & SSE related?
- Both are using residual. 2. SSE is sum of all squared residuals. 3. SEE is standard deviation of the residuals. SEE=Sqrt[SSE/(n-k-1)]
Give two formula for variance of regression
- SSE/(n-k-1) 2. SEE squared.
What does R squared (coefficient of determination) describe?
The fraction of the unexplained variation / total variation SSE / SST =SUM SQUARED ERRORS(Ypred-Yact))/SUM SQUARED (Yact-Ymean)
What is the variance of Yact around Ymean
Total sum of squares (TSS) = sum square(Yact-Ymean)
What is data wrangling What is the purpose
Data wrangling, sometimes referred to as data munging. The process of transforming and mapping data from one “raw” data form into another format. The purpose of making it more appropriate and valuable for a variety of downstream purposes such as analytics.
What is winsorization?
Cap and Floor to outliers
What does standardisation of data require
Normal distribution
What does standardisation do? How is it calculated?
Centers and rescales (X-mean)/stdev
Describe normalisation
Rescales between 0 and 1
What is a unigram
Single word token
Does the numerator or denominator drive the sign of both the correlation and slope coefficients?
Because the denominators of both the slope and the correlation are positive, the sign of the slope and the correlation are driven by the numerator: If the covariance is positive, both the slope and the correlation are positive, and if the covariance is negative, both the slope and the correlation are negative.
What is consistency of coefficients
The values each slope coefficient will converge to
The test-statistic to test whether the correlation is equal to zero is
t=r√(n-2) /√(1−r2)