L6 - (PL) Binary Choice Models Flashcards
(14 cards)
What are we looking at with simple linear regression?
- The relationship between a pair of continuous variables, which we denote by Y and X. If only two variables are involved, we have bivariate regression
- Y is the outcome variable (also called a response or dependent variable),
- X is the explanatory variable (also called a predictor or independent variable
- In its simplest form, a regression analysis assumes that the relationship between X and Y is linear, i.e., that it can be reasonably approximated by a straight line.

What is the equation for a linear regression model?
- Using a method called least squarest in which the usm of the squared residual is minimised we estimate betas and ‘y’ –> usually right a hat above them to denoted them as estimates

Assumptions about the residuals in OLS?
Given the assumptions of normality and homoscedasticity we can summaise the variability of data around our linear regression in a single statistics - the variance of the residual (σ2 ) .residual variance is as the part of the variance in y that is unexplained by x
- why could residuals be correlated with each other?
- often observes various individuals over time so we can see that individuals contribute to more than own observations –> repeated measures
- Residuals may be correlated over time due to this but not accross individuals!
- often observes various individuals over time so we can see that individuals contribute to more than own observations –> repeated measures
- residuals may be correlated as individuals are clustered in some way
- data on results of students across different universities
- results of students on a the same course may be correlated
- same could be said at the university level ==> use multi-level models to deal with this but not on this course
if these assumptions are not the estimate of the betas may be biased and imprecise

A general summary of hypothesis testing?

What are the different types of data we will be dealing with?
Dependent variable
This course we will look at model that are in bond below, instead of continuous models with interval or ratio measurements
- Qualitative vs Quantitative
- •Continuous vs Non-continuous (discrete variables –> not infinitely divisible)
- •Scale of Measurement:
- –Nominal (categorical)- values provide classification but no indication of an order. Numbers are only used to categorise objects. Mathematical operations are meaningless.e.g. race,sex,
- –Ordinal- values provide an indication of an order. Cannot determine distances between the objects. Mathematical operations are meaningless.–> education level, income level, satisfaction rating
- –Interval- values provide an indication of an order. Have an equal distance between scale points. Ratios are meaningless (Can say that 40 degrees is twice that of 20 degrees) .—> e.g. temperature
- –Ratio- values provide indication of order. Have an equal distance between scale points. Zero represents an absence of the object. Mathematical operations are meaningful.
How are we defining choices in this module?
- Decision makers can be individuals, firms and various institutions.
- There are reasons and constraints for choices.
- Choices can be repetitive or one-off.
- To arrive at a choice, a set of alternatives needs to be evaluated –> called a choice.
- Choices are affected by attributes and decision-maker characteristics.
What are the characteristics of the Choice Set?
-
Alternatives must be mutually exclusive –> on alternative implies that you arent picking any other choice the choice set
- A, B and AnB are all separate choices (the joint one is counted as a separate one)
-
Alternatives must be mutually exclusive –> on alternative implies that you arent picking any other choice the choice set
-
The choice set must be exhaustive –> all possible choices are included and the decision making only choices one
- What if its not exhaustive? ( decision making can pick none of the options?) –> add an additional alternative of ‘none of the above’
-
The number of alternatives must be finite –> set of choices are countable
- defining characteristics of discrete models
Problems with using OLS on a discrete choice model (Problems with linear probability model (LPM)?
- OLs assumes that the disturbances are normally distributed
- OLS assumes the error is homoskedastic, but The error term in the LPM is heteroskedastic
- The estimated Y will not necessarily lie between 0 and
-
•LPM assumes that P increases linearly with X, that is, the marginal or incremental effect of X remains constant throughout
-
Non-linearly linked to X, looking at home ownership against income, the probability of owning a house does not increase equally with every step up in income, instead, those with low-income wont own one but at a sufficiently high level of income means that they will probably be able to but own
- thus probability of owning a house will be largely unaffected by small incremental changes in income
-
Non-linearly linked to X, looking at home ownership against income, the probability of owning a house does not increase equally with every step up in income, instead, those with low-income wont own one but at a sufficiently high level of income means that they will probably be able to but own
What are the features a probability model should have?
- •As Xi increases, Pi = E(Y=1|X) increases but never steps outside the 0-1 interval
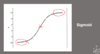
- The relationship between Pi and Xi is non-linear, that is, one which approaches zero at slower and slower rates as Xi gets small and approaches one at slower and slower rates as Xi gets very large
- Following our income example, the Sigmoid curve shows that at low income, most people cannot buy a house whereas people with sufficiently higher incomes have a high chance to –> and at both these extreme incremental changes in income makes little changes the this probability
- The probability of buying a house is the most affected in the middle (50% chance) buy a change in income
So what is the main difference between using linear regressions and using non-linear models?
Linear regressions ==> modelling the conditional mean
Non-linear models ==> modelling probabilities
What are some assumptions that underlie the Binary Choice Model?
- Discrete choice models are usually derived under the assumption of utility maximising behaviour by the decision-makers
- These models can also then be used to represent decision making that doesn’t necessary entail utility maximising
- Models can link explanatory variables to outcomes of choice without necessarily explaining how the choice is made
- BCM:
- Decision maker ‘n’ maximises utility
- Utility is NOT known to the researcher.
- The decision-maker will gain some utility from each alternative –> Unj, j=1,… J
- Two alternatives (Binary choice model)
- Utility is known to the decision maker
- Uni >Unj for ‘chosen’ i and any j ≠ i
What are the factors that determine the Choice?
Factors that determine the choice:
- Researchers does not observed utility but instead some attributes of the alternatives labelled ( xnj ) and some attribute of the decision makers labelled (sn)
- j subscript is dropped on sn as the decision-makers characteristics don’t necessarily change across decisions
- Example of characteristics e.g. age, gender, income, education –> these will not vary under whatever alternative the decision-makers is facing
- factors that affect utility that are unobserved ==> εnj
- representative utility (what the researcher observes) –> Vnj = V(xnj ,sn) for every j
- Unj =Vnj + εnj
- Representative utility +unobserved factors
- As ε is not observed, its characteristics, such as distribution, depend on the researcher’s specification.
- ε – random with density f(ε). With this density, the researcher can make probabilistic statements about the decision maker’s choice.
- Line 1 –> Probability that the decision-maker chooses i
- Line 2 –> sub for utility
- Line 3 –> observed utility needs to be greater than unobserved

How else can we write the probability that the decision-maker chooses ‘i’?
- I =indicatory function
- 1 if the statement in the brackets is true
- 0 otherwise
- This is actually a multidimensional integral over the density of the unobserved portion of utility f(εn)
- Integral can take closed from for certain specifications
- Imagine a population of people
- observed V is the same for all of them but the unobserved portion differs by individual
- so the density f(εn) is the distribution of the unobserved portion of utility within the population of people who face the same portion of utility
- The probability that decision-maker ‘will choose ‘i’ is the share of people in the population who would choose ‘i’ who face the same observed utility for each alternatives as person ‘n’

What does choice probability not depend on with regards to utility?
- the absolute level is also irrelevant to decision makers behaviour and the researchers model
- So even if a constant was to the utility of alternatives, the alternatives with the highest utility wouldn’t change
- constant would increase all utilities
- So even if a constant was to the utility of alternatives, the alternatives with the highest utility wouldn’t change