L5 - VARs and VECMS Flashcards
(23 cards)
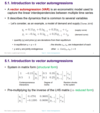
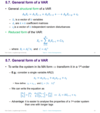
What is a VAR?
- Structural form
- Contemporaneous interaction –> moving all the qt and pt onto one side
- Reduced form
- Matrix created by moving the contemporaneous interaction matrix to the RHS and taking by taking the inverse
What will the reduced form VAR errors look like?
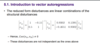
How does the system behave when subject to random shocks?
- backwards substitution like an AR(p) process
- Subbed in for qt-1 and pt-1 , in the reduced form matrix (as the initial shocks arent multiplied by anything)
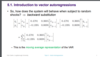
example of an impulse response to a VAR system?
- matrix means:
- middle matrix –> inverse of the contemptuous integration
- last vector –> error term
- Combined with the middle matrix it creates vit
- Impulse response:
- Unit supply shock
- the significant initial impact on q, with a small negative impact on p
- Unit demand shock
- small impact on q, with a significant initial positive impact on p
- Unit supply shock
- Impacts decrease over time till it converges to zero
- Accommodated into the system
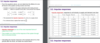
Example impulse response graphs to a supply and demand shock?
- system only returns to its equilibrium position if they are stationary
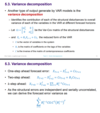
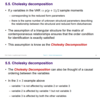
What is variance decomposition?
Ω matrix –>Var-Cov matrix of the structural disturbamces that are not correlated( don’t covary) but have their own variances
𝐶εt = vt
- From below we have the matrics B1 and C:
- To compute the variance decomposition
- we assume that the variances of the structural disturbance are the same
- so that the matrix Ω becomes an identity matrix
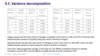
Example of our variance decomposition after the Supply and Demand Shocks?
- Quantity
- Use top number for Supply % –> SR impact
- Use bottom number for Demand % –> LR impact
- Prices
- Bottom number for Supply % –> LR impact
- Top number for Demand % –> SR impact
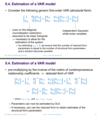
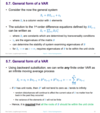
How can we go about estimating a VAR model?
lower triangular matrix means that we can definition compute the inverse
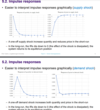
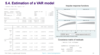
Example estimation of a VAR model?
trend evolves closely together –> stochastic trend
- irf –> standard unit impulse function (code)
- bottom right- –> var-cov matrix for the residuals showing correlation
- GRAPHS: left impulse, right response
- shock of 1 unit to the Fed rate will take 8 periods to return to equilibrium
- impact on the 3 month t-bill rate is small when there is a shock to the fed rate
- With a shock on the 3 month t-bill rate, we see an increase in the fed rate over time –> it will cover/respond to other increases in the treasury bill (in the lR move towards 1)
- shock to the 3 month treasury bill rate is 1 and will remain there even in the LR
How can we recover the structural parameters from a VAR model estimation?
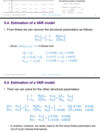
How do you estimate the Variance Decomposition?
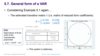
What is the Cholesky decomposition?

Cholesky decomposition: sample moments and causal ordering?
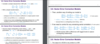
Example of using the Cholesky decomposition?
- upper triangular matrix –> assumes that fed rate is affected by both itself and the 3m t-bill rate
- whereas the t-bill rate is only affected by itself
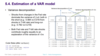
How can we decide on the casual ordering of the variables?
- In the granger test, the left variables are dependent and the right are the independent
*
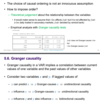
What is the general Granger Causality test then?
What is the general form of the VAR (in matrix notation)?
- Only can find the reduced for if A0 is invertible
What is th solution to a general system of VAR?
- eigenvalues are needed to find out whether the system is stationary/stable
- cannot write a VAR system as a infinite moving average process if the system is not stationary
Example of using eigenvalues and the unit circle?
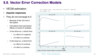
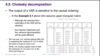
What do we do if a variable in a VAR is not stationary?
- In the discussion of VAR models above we assumed that the variables in the model should be stationary
- • What if one or more variables are non-stationary?
- – standard statistical distributions not appropriate (results not valid)
- – problems in interpreting the model and associated outputs
- • How to overcome this problem?
- – make them stationary –> variables should be differenced
- • What if there are long-run or cointegrating relationships?
- – rely on Vector Error Correction Models (VECM)
Cointegrating vector are the betas
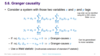
How are the outputs of VECM and VAR similar and different to each other?
- The output of a VECM is very similar to a VAR
- – Impulse responses quantify response of variables to random disturbances
- – Variance decomposition measures proportion of k-step ahead forecast variance that is explained by each of the random disturbances
- • Both calculated in the same way as for the VAR
- • One important difference
- – VAR with stationary variables –> impulse responses converge to zero
- – Not the case for VECM
- • if we write it in levels, where 𝑥 and 𝑦 are 𝐼(1), the transition matrix will contain at least one unit root
- • random shocks to the system will have permanent effects on the levels of the variables
Example of a VECM estimation?
- First coefficient estimates are the rate of adjustment parameter
Final conclusion –> if the BoE rate goes up by 1% the 10 year bond rate will vary by the same amount in the same direction –> WHY IS THE SIGN NEGATIVE THOUGH
Example of an impulse response of the VECM estimation?
- t-bill causes an intial increase to itself from the shock but returns t o1 and stays there forever
- BpE rate will also tend to increase permanently over time due to a 10 year bond rate shock
- After a BoE shock there is no initial change in the 10 year yields. But over time (after 2 periods onwards) they start to increase
- BoE shock causes a slight increase in the BoE rate but afterwards, the shock persists into the future