Hypothesis Testing Flashcards
Hypothesis for 1 Sample Z-Test and 1 Sample T-Test
Ho: µ=μ0
Ha: µ≠μ0
Hypothesis for Matched Pairs T-Test
Ho: µd=0 The mean difference is 0
Ha: µd≠0 There is a mean difference
Hypothesis for 2 Sample T-Test
Ho: µ1= µ2
Ha: µ1≠ µ2
Hypothesis for 1 Prop Z-Test
Ho: p = po
Ha: p ≠ po
Hypothesis for 2 Prop Z-test
Ho: p1 = p2
Ha: p1 ≠ p2
Conditions for 1 Sample Z-Test
1) sigma (σ)known
2) SRS
3) Normality
Explain normality by the population being normal or by use of CLT
Conditons for 1 Sample T-Test
1) sigma (σ) unknown
2) SRS
3) Normality
Explain normality by the population being normal, by use of CLT or by graphing the sample data to show symmetry and no outliers
Conditions for Matched Pairs T-Test
1) Two dependent samples
2) sigma (σ) unknown
3) SRS
4) Normality
Explain normality by the population being normal, by use of CLT or by graphing the sample data to show symmetry and no outliers
Conditions for 2 Sample T-Test
1) Two independent samples
2) SRS for both samples
3) Normality in both samples
Explain normality by the population being normal, by use of CLT or by graphing the sample data to show symmetry and no outliers
Conditions for 1 Prop Z-Test
SRS,
Normality shown by np>10 and n[1-p]>10
Pop at least 10x sample shows that the formula for standard deviation can be used.
Conditions for 2 Prop Z-Test
SRS for both samples
Two independent samples,
normality is shown by all 4 parts (n1p1>10, n1[1-p1]>10, n2p2>10, n2[1-p2]>10)
Pop at least 10x sample so that the formula for standard deviation may be used
1 Sample Z-Test Statistic

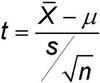
1 Sample T-Test Statistic

2 Prop Z-Test Statistic

Matched Pairs T-Test Statistic
Where “mu” = 0
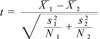
2 Sample T-Test Statistic
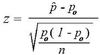
1 Prop Z-Test Statistic
Type 1 Error
Rejecting the null hypothesis when it is actually true
H0 is true
H<sub>a</sub> is true
Reject Ho
**Type I Error**
Correct decision
Accept H0
Correct Decision
Type II Error
Type II Error
Accepting the null hypothesis when the alternative is actually true.
Ho is true
H<sub>a</sub> is true
Reject Ho
** **Type I Error
Correct decision
Accept Ho
Correct Decision
Type II Error
