Heart Physiology Flashcards
In an ECG, what does the P waveform represent?

First half - stimulation of right atrium
Second half - stimulation of left atrium
In an ECG, what does the PR Interval represent?

Depolarization of right and left atria
Spread of the impulse through the AV node
In an ECG, what does the QRS complex represent?
Spread of electrical impulse through the ventricles
In an ECG, what does the ST Interval represent?

Ventricular Systole (contraction)
In an ECG, what does the T wave represent?

Repolarization of ventricular contractile fibers
What is the graph labeled A measuring?
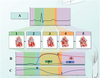
Electrical impulse (ECG)
What is the graph labeled B measuring?

Pressure
What is the graph labeled C measuring?

Ventricular Volume
What is the stage labeled 1?

Atrial Contraction and Ventricular Filling
What is the stage labeled 2?

Isovolumetric Contraction
What is the stage labeled 3?

Ventricular Ejection
What is the stage labeled 4?

Isovolumetric Relaxation
What is the stage labeled 5?

Atrial relaxation and ventricular filling
What does the green line (D) represent?

Left Atrium
What does the red line (E) represent?

Aorta
What does the blue line (F) represent?

Left Ventricle
What does the dip in the red line (G) represent?

Dicrotic notch
Blood pushing back against the valve that did not make it over the aorta
What does the level at H represent?

End-Diastolic Volume
What does the level at I represent?

End-Systolic Volume
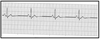
What does this ECG reading indicate?

Normal at 80 BPM
What does this ECG reading indicate?
Sinus Bradycardia at 40 BPM
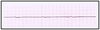
What does this ECG reading indicate?

Sinus Tachycardia at 115 BPM
What does this ECG reading indicate?

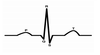
Premature Ventricular Complex (PVC)
What does this ECG reading indicate?
Ventricular Tachycardia (VT)
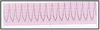
What does this ECG reading indicate?

Ventricular Fibrillation (VF)
What does this ECG reading indicate?
Asystole
What are the pulse points of the human body?
Temporal Artery
Facial Artery
Carotid Artery
Brachial Artery (bicep)
Radial Artery (wrist)
Femoral Artery (upper inner thigh)
Popliteal Artery (back of knee)
Posterior Tibial Artery (ankle)
Dorsalis Pedis Artery (top of foot)
What is stroke volume?
Blood pumped per beat
What is cardiac output?
Blood pumped per minute
What is the order of the conduction system?
Sinoatrial (SA) node
AV node
AV bundle
Right and left bundle branches
Purkinje fibers
