EBM Tables and Equations Flashcards
(46 cards)
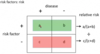
Prevalence =
(total #sick)/(total population)
- how many people are sick
- a single time point
- Prevalence can be used to estimate the likelihood of a diagnosis before any “tests”
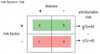
Cumulative incidence:
(new cases)/(total population at risk at study start)
- how many people are getting sick (NEW CASES)
- incidence is a rate, it happens over a time interval
Incidence equation in steady state:
prevalence / duration
Duration equation in steady state:
prevalence / incidence
Prevalence equation in steady state:
(incidence) X (average duration)
alpha =
- the probability you’ll make a false hit.
- Arbitrarily, p = 0.05
- false hit = type 1 error
- 5% of the time, we’ll make an error
beta =
- probability you won’t find a difference when one actually exists (false miss)
- false miss = type 2 error
- probability of missing a reality
power =
1 - beta
- power of study to pick up a study when it actually does exist
- Low power is a common reason for type II errors.
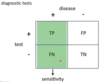
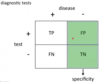
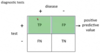
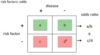
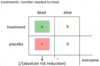
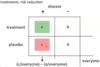
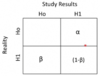
2 X 2 tables for hypothesis testing:
(alpha, beta, and power)
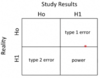
2 X 2 tables for hypothesis testing:
(type 1 and 2 errors)
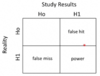
2 X 2 tables for hypothesis testing:
(false hits and false misses)
95% CI equation:
95% CI = mean +/- 1.96(SEM)
- SEM = SD/ √n
Standard error of the mean (SEM) eqaution:
SEM = SD/ √n
- SD = standard deviation
- n = sample size
The three types of prevention:
- Primary: before exposure (PREVENT)
- Secondary: after exposure (SCREEN)
- Tertiary: after disease process occurs (TREAT)
Standard deviation:
+/- 3SD contains –% of observations
99.7%
Standard deviation:
+/- 1SD contains –% of observations
68%
Standard deviation:
+/- 2SD contains –% of observations
95%
The three types of variation:
-
Overall variation:
- measurement variation + biological variation
-
Measurement variation:
- instrument variation + observer variation
-
Biological variation:
- intra-individual and inter-individual
The dependent variable is on what axis?
Y-axis
The independent variable is on what axis?
X-axis
Regression r-value close to 0:
no association
Regression r-value close to 1:
strong association
Regression r-squared value tells you:
- the amount of variation in Y that is contributed by variation in X.
Three ways you can control for outliers:
- using non-parametric test
- dropping the outlier(s)
- log transformation