Chapter 5 Flashcards
(36 cards)
Sample Statistics
Summarizes sample characteristics
Parameters
Summarize population characteristics
Sample Mean
Mean of the sample,

Sample Proportion
Proportion of sample,

Population Mean
Mean of the population,

Population Proportion
True proportion, p
Statistic as a RV
Statistic is a random variable and will have a distribution assigning probabilities to different samples
Sampling Distribution
Probability distribution of sample statistics, tells us how much a statistic would vary from sample to sample
Mean of Sample Proportion
Mean p
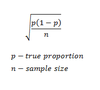
Standard Deviation of Sample Proportion
SD
When is distribution approximately normal?
When for a sample size n with true proportion p, both np and n(1-p) are greater than or equal to 15
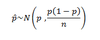
Normal Distribution of Sample Proportion
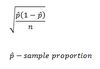
Standard Error
Estimate of standard deviation of sampling distribution
What happens to standard deviation as sample size n increases?
Standard deviation decreases
Smaller the standard deviation…
…closer the sample proportion is to the population proportion
Empirical Rule
Nearly all sample proportions for size n with true proportion p will lie between

Probability with Normal Distribution and pHat

Sample mean distribution centered around…
True population mean mu
Sample mean distribution standard deviation

Sample Mean Normal Distribution

What does increasing sample size n do to sample means?
Vary less and less tending toward true population mean
Central Limit Theorem
As sample size increases, sampling distribution of sample mean tends to a normal distribution, even if population distribution far from bell-shaped
Ensuring normal distribution for standard mean
n greater than or equal to 30
Statistical Inference
Making decisions about parameters using statistics

