Chapter 3 Flashcards
Good data collection
A realistic and sound plan is needed to develop a study that is a good representation of the population
Three steps in designing a study
- Identify population of interest 2. Compile list of subjects 3. Decide sampling design
Note on identifying population of interest
Have to have the population match the study’s question
Sampling Units
Subjects of interest
Sampling Frame
List of subjects to sample from
Sample Design
Method of drawing samples from the sample frame
What makes a good Sampling Design?
Resulting sample is a good representative of the population and reflects characteristics of the population
Three types of Sample Designs
- Simple Random 2. Cluster 3. Stratified
Simple Random Sampling
Sample guided by equal chance, given a population of n subjects, each possible sample of that size (n) has the same chance of being selected
Fraternity example
Two of five officers set to go on trip, picked randomly from a hat. Possible samples of officers are C(5,2) = 10. Chance of selecting any one of samples is 1/10 and each officer appears 4/10 samples, each has a 4/10 = 2/5 chance of selection
Random Number Tables (Generators)
Number assigned to subjects in frame; random numbers of same length as above generated; subjects with numbers generated selected and process stopped when sample size is reached
Cluster Sampling
Population divided into large number of clusters and simple random sample of pre-specified number of clusters selected
Cluster Random Sample
All samples in the clusters chosen during the cluster sampling
Stratified Sampling
Population divided into separate groups (strata) and a simple random sample is selected from each
What you need for Stratified Sampling
Access to sampling frame and strata into which each subject belongs
Margin of Error
Potential error range in estimations
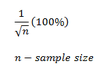
Sampling Fraction
Ratio of sample size n to population size N (n/N)
What if n/N is less than or equal to 0.05?
Margin of error is given by:
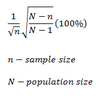
What if n/N is greater than or equal to 0.05?
We use finite population correction:
True proportion
Between the observed proportion ± margin of error
Bias
Responses from sample tend to favor parts of population and aren’t representative of the whole
Three types of Biases
- Sampling 2. Non-response 3. Response
Sampling Bias
Results from flaw in sampling method, especially if sample is non-random
Under-Coverage
Sampling frame that lacks representation from parts of the population
Non-Response Bias
Results when some sampled subjects cannot or refuse to participate; even those willing to may only do so since they have strong views on the subject
Response Bias
Results from actual responses, may be due to the way the question is asked or if people believe their responses are socially acceptable
Convenience Sample
Easily obtainable samples such as stopping people on the street
Problem with Convenience Sampling
May result in serious biases
Volunteer Sample
Subjects volunteer to be in survey
Problem with Volunteer Sampling
Inherent biases; one segment may be more likely to volunteer due to their strong opinions
Simple Random Sample vs. Non-Random or Convenience Sample
Former less likely to be affected by the biases
Statistical Association
Change in one variable is companied with the change of the other
Response Variable
Dependent variable, outcome that depends on the independent variable
Explanatory Variable
Independent variable or covariate, which may explain or be related to the outcome
Statistical Association and causal relationships
Does not necessarily provide this between the response and explanatory variable
Lurking Variables
Also called confounders; associated with both the response and explanatory variable giving misleading impressions about their relationship
Lurking Variable in the cell phone use - eye cancer - computer use example
Computer use
Experimental Study
Researchers assign subjects to experimental conditions (treatments) based on explanatory variables and then get outcomes on response variable
Treatments
Experimental condition groups based on levels of one explanatory variable or a combination
Observational Study
Researches do NOT assign subjects but simply observe response and explanatory variables possessed by subjects
Advantage of Experiments w/ causal relationships
Experiments can establish causal relationships because they control over lurking variables by allocating subjects to different treatments
Disadvantage of Experiments
Not easy and often unrealistic to do; subjecting humans to potentially unethical treatments may cause concern
Advantages of Observational Studies
Preferred especially medical field where results can be gathered without treatments or when researchers aren’t interested in assessing causality
Experimental Units
Subjects in sample
Factors
Categorical explanatory variables in experiment
Levels
Categories of factors
Placebo
Secondary no-go treatment against which effectiveness of primary treatment is tested
Placebo Effect
Better responses if people are given a placebo rather than nothing
Control Group
Group who receives placebo or new treatment against old
Randomization
Randomly assigning experimental units into treatment groups
Three Goals of Randomization
- Balance treatment groups 2. Eliminate effect of lurking variables 3. Reduce bias
Double-Blinded
Neither subjects nor data collectors know about treatment assignment
Nine Components of Experiment
- Response Variable 2. Explanatory Variable (Factor/Covariate) 3. Levels 4. Confounders (Lurking Variables) 5. Experimental Units 6. Levels 7. Treatments 8. Control Group 9. Randomization
Cross-Sectional Study
Sample survey takes a snapshot or cross-section of population at a given point in time
Retrospective Study
Observational study in which researcher looks for outcome first and then looks at covariate/explanatory variable later
Cases
Group who has a particular disease or trait to be observed
Controls
Group without the disease or trait
Case-Control Study
Retrospective study involving cases and controls
Estimating population percentages from Case-Control Study
Can’t do it since the cases and controls are often randomly decided
Prospective Study
Group of subjects (cohorts) followed over time and the outcome is noted
Systematic Sampling
1/m of a group of n are sampled (say 1/5 of every incoming person into a concert)
Z-Score Reminder
What to do in cases of Bias
New sample design/plan to remove bias
Determining if a causal relationship is legitimate
Groups need to be randomized and experiments are preferred to observations since they can control for confounders