Chapter 2 - Describing Data with Numerical Measures Flashcards

1
Q

Graphical methods may not always be sufficient for describing data. __ __ can be created for both populations and samples

A

numberical measures

2
Q

a numerical descriptive measure calculated for a population. Fixed (unknown) value.

A

Parameter

3
Q

a numerical descriptive measure calculated for a sample. Varies over samples

A

Statistic

4
Q

A measure along the horizontal axis of the data distribution that locates the center of the distribution.

A

Measure of Center

5
Q

the sum of the measurements divided by the total number of measurements.

A

MEAN

6
Q

Sample Mean

A

x-bar = Σ(xi) / n n = sample size (# of measurements)

7
Q

If we were able to enumerate the whole population, the population mean would be called?

A

µ (mew)

8
Q

the middle measurement when the measurements are ranked from smallest to largest

A

MEDIAN

9
Q

Position of the Median (equation)

A

.5(n +1)

10
Q

The measurement which occurs most frequently

A

Mode

11
Q

The __ is more easily affected by extremely large or small values than the __.

A

mean, median

12
Q

The __ is often used as a measure of center when the distribution is skewed

A

median

13
Q

Mean vs Median 1) Symmetric 2) Skewed right 3) Skewed left

A

1) Mean = Median 2) Mean > Median 3) Mean < Median

14
Q

A measure along the horizontal axis of the data distribution that describes the spread of the distribution from the center.

A

Measure of Variability

15
Q

Difference between the largest and smallest measurements.

A

Range (R)

16
Q

Measure of variability that uses all the measurements. Measures the average (squared) deviation of the measurements about their mean

A

Variance

17
Q

The variance of a POPULATION of __ measurements is the average of the squared deviations of the measurements about their mean __.

A

N, µ

18
Q

The variance of a SAMPLE of __ measurements is the sum of the squared deviations of the measurements about their mean, divided by ___.

A

(n-1)

19
Q

Variance of a Population (equation)

A
20
Q

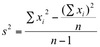
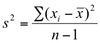
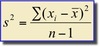
Variance of a Sample (equation)

A
21
Q

1) In calculating the variance, we squared all of the deviations, and in doing so changed the __ of the ___.
2) To return this measure of variability to the original units of measure, we calculate the __ __.

A

1) Scale of the Measurements
2) Standard Deviation

22
Q

1) Standard Deviation of POPULATION
2) Standard Deviation of SAMPLE

23
Q

The value of s is ALWAYS ?

24
Q

The larger the value of s2 or s, the larger the __ of the __ __.

A

variability of the data set.

25
Calculational Formula for Sample Variance
26
Definition Formula for Sample Variance
27
Tchebysheff's Theorem
Given a number k ≥ 1 and a set of n measurements, at least 1-(1/k2) of the measurement will lie within k standard deviations of the mean.
28
Tchebysheff’s Theorem 1) If k=2? 2) If k=3?
1) at least 3/4 of the measurements are within 2 standard deviations of the mean. 2) at least 8/9 of the measurements are within 3 standard deviations of the mean.
29
Empirical Rule Given a distribution of measurements that is approximately mound-shaped: 1) The interval µ ± σ contains approximately \_\_% of the measurements. 2) The interval µ ± 2σ contains approximately \_\_% of the measurements. 3) The interval µ ± 3σ contains approximately \_\_% of the measurements.
a) 68% b) 95% c) 99.7%
30
Tchebysheff's Theorem must be true for which data sets?
ALL
31
1) From Tchebysheff’s Theorem and the Empirical Rule, we know that R ≈ ? 2) To approximate the standard deviation of a set of measurements, we can use:
1) R ≈ 4-6 s 2) s ≈R/4 or s≈ R/6 for large data set
32
Measurement of how many standard deviations away from the mean
Z-score = x -x̄ / s
33
What values would we indicate as outliers?
zscore that is: z\<-3 OR z\>3
34
Measurement of how many measurements lie below the measurement of interest
Pth percentile
35
the value of x which is larger than 25% and less than 75% of the ordered measurements.
Lower Quartile (Q1)
36
The value of x which is larger than 75% and less than 25% of the ordered measurements.
Upper Quartile (Q3)
37
The range of the “middle 50%” of the measurements
Interquartile Range
38
Interquartile Range (IQR) equation
IQR = Q3-Q1
39
Position of Q1
.25(n+1)
40
Position of Q3
.75(n+1)
41
If the position of Q1 or Q3 are not integers, find the quartiles by?
Interpolation (1st position # + .25/.75(2nd position # - 1st position #)
42
Five Number Summary
Min Q1 Median Q3 Max
43
Use the Five Number Summary to form a __ \_\_ to describe the __ of the distribtion and to detect \_\_\_.
Box Plot Shape Outliers
44
Constructing a Box Plot 1) Calculate? 2) Draw horizontal line to represent? 3) Draw box using?
1) Q1, median, Q3, IQR 2) draw horizontal line to represent scale of measurement 3) draw box using Q1, median, Q3
45
Constructing a Box Plot 1) Isolate Outliers by Calculating? 2) Equations?
1) Lower and Upper Fence 2) Lower Fence: Q1-1.5 IQR Upper Fence: Q3+1.5 IQR
46
Measurements beyond the __ and __ \_\_ is/are outliers and are marked \_\_.
upper or lower fence marked (\*)
47
Generic Box Plot Diagram
48
Draw “whiskers” connecting the __ and __ \_\_ that are NOT __ to the box.
largest and smallest measurements outliers
49
Box Plot of symmetric distribution
Median line in center of box and whiskers of equal length
50
Box Plot - skewed right
Median line left of center and long right whisker
51
Box Plot - skewed left
Median line right of center and long left whisker