Cardiovascular System Flashcards
Cardiovascular Anatomy
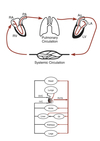
Basics
Inferior/Superior Vena Cava (spO2 ~ 75%) ⇒ Right Atrium ⇒ Tricuspid Valve ⇒ Right Ventricle ⇒ Pulmonic Valve ⇒ Pulmonary Artery ⇒ Pulmonary Circulation (~2-25 mmHg)
Pulmonary Vein (spO2 ~ 95%) ⇒ Left Atrium ⇒ Mitral Valve ⇒ Left Ventricle ⇒ Aortic Valve ⇒ Aorta ⇒ Systemic Circulation
- Pulmonary and systemic circulations arranged in a series circuit.
- All 5 L of blood can be “processed” by the lungs before being sent back into systemic circulation
- Organs within the systemic circulation are arranged in parallel circuits.
- Each organ receives fully oxygenated blood
- Flow to an organ an be changed without affecting flow to other organs
- One exception is the liver:
- Receives fresh blood via hepatic artery in parallel manner
- Receives blood from GI system via portal vein in series manner
Fick’s Equation
Oxygen Consumption
A measure of O2 consumption (VO2)
VO2 = CO x (arterial O2 - venous O2)
CO = cardiac output (in liters/minute)
arterial O2 - venous O2 = the amount of oxygen extracted from the blood as it travels through the circulation
Cardiac Output
(CO)
CO = HR x SV
HR = Heart Rate
SV = stroke volume
Hemodynamics
Basics
Blood flow is proportional to the pressure difference (ΔP) not the absolute pressure.
Vast network of vessels in the sytemic circulation provides resistance to flow (R).
Largest drop-off in pressure occurs at the resistance arterioles before the capillaries.
Blood Flow
Calculation
Q = ΔP / R
Q = blood flow (cardiac output)
ΔP = pressure difference
R = resistance
R = Δ P / CO
= (MAP - CVP) / CO
MAP = mean arterial pressure
(normally ~ 95 mmHg)
CVP = central venous pressure
(pressure in the vena cava ~ 2 mmHg)
CO = cardiac output
(normally 5-6 L/min)
Average Circulatory Pressures
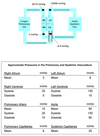
Blood Pressure
Maintenance
Pressure gradient must be maintained for continued flow.
Mechanisms exist to restore a decreased pressure gradient:
-
Reduce outflow
- Increase resistance to organ systems that do not have a high demand for nutrients.
- Facilitated by the parallel arrangement of organ systems.
- Controlled mainly by the sympathetic NS.
-
Increase inflow by increasing cardiac output
- Increasing heart rate
- Increasing contractility
- Through preload/inotropic state
- Causes heart to move more blood per beat
- Controlled by ANS
-
Increase blood volume
- Blood shifted from the venous system short term
- Controlled by the ANS
- Salt and water retained from the kidneys long term
- Hormonal control
- Blood shifted from the venous system short term
Venous Reservoir
- Veins experience less pressures than arteries.
- More compliant and distensible.
- 60-70% of total blood volume stored in venous system.
- Venous smooth muscle contraction activated by the sympathetic NS pushes more blood into the arterial system.

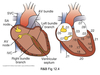
Cardiac Excitation Pathway
Wave of excitation carried by propagating action potentials.
Caused by a cycling of ionic permeability of the cell membrane.
- Action potential generated in the SA node.
- Depolarize atria.
- Depolarize AV node.
- Depolarize septum from left to right.
- Depolarize anteroseptal region of the myocardium towards the apex.
- Depolarize bulk of ventricular myocardium from endocardium to pericardium.
- Depolarize posterior portion of base of the left ventricle.
- Ventricles now depolarized.
Cardiac Action Potential
Functions
- Pacemaking by the SA node
-
Conduction of the impulse through the heart
- AV node
- bundle of His
- Purkinje fibers
- Initiating and controlling contraction
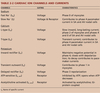
Cardiac Action Potential
Classes
Due to the types of voltage-gated ion channels present.
A reflection of the functional roles of each region.
Fast AP
contracting regions: atrial & ventricular muscle
fast conduction: bundle of His, Purkinje fibers
Slow AP
pacemaking: SA node
slow conduction: AV node
Fast Action Potentials
- Found in the atria, ventricles, and fast conducting regions of the heart (H/P system).
- Longest action potentials in the heart (up to 300 msec).
- Long plateau phase.
- Stable resting potential between AP.
Fast action potentials have 5 characteristic phases:
Phase 0
- Rapid depolarization due to the activation of inward Na+ channels (INa).
- Rate of phase 0 depolarization sets the conduction velocity.
Phase 1:
- Small initial repolarization due to the inactivation of Na+ channels (INa) and activation of a transient outward K+ channel (Ito)
Phase 2:
- Long plateau phase mediated by slowly activating inward Ca2+ channels.
- L-type ICa
- Entering calcium is the triggering Ca2+ used to activate CICR initiating atrial and ventricular contraction.
Phase 3:
- Repolarization due to inactivation of Ca2+ channels and activation of several different K+ channels (IKr, IKs)
Phase 4:
- Stable resting membrane potential due mainly to inwardly-rectifying K+ channels (IK1)
- Potassium conductance decreases transiently then come back up.
- Energy saving mechanism so that the Na+/K+-ATPase does not have to pump as much K+ back into the cell.

Slow Action Potentials
- Found in the SA and AV nodes.
- Shorter in duration.
- Rate of depolarization slower.
Slow action potentials have only 3 distinct phases:
Phase 0:
- Slow depolarization due to activation of slow-activating Ca2+ channels (L-type ICa)
Phase 1 and 2 absent.
Phase 3:
- Repolarization due to Ca2+ channel inactivation and activation of K+ channels (IKr)
Phase 4:
- Slowly depolarizing unstable resting potential due to If and IKAch channels.
- For the SA node this is how threshold is reached and AP generated.
- Rate of phase 4 depolarization sets HR
Absolute Refractory Period
An action potential cannot be elicited in a single cell regardless of the stimulus.
Effective Refractory Period
(ERP)
A propagated action potential cannot be elicited with a normal stimulus such as that generated by the SA node.
Applies to the heart as an organ.
Ensures that AP potentials travel one way.
Alterations in ERP can lead to arrhythmias.
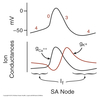
SA Node Pacemaking
Slowly depolarizing phase 4 of the SA and AV nodes provides a mechanism for pacemaking.
- Membrane slowly depolarizes until it reaches threshold at which time an AP fires.
- Rate of depolarization sets time it takes to reach threshold and thus firing rate or HR.
Spontaneous depolarization due to an imbalance between outward and inward currents:
inward > outward = depolarization
- Outward current carried by Ach-activated K+ channels (IKAch aka IGIRK)
- GIRK = G-protein coupled inwardly rectifying potassium channel
- Causes hyperpolarization
- Increased IGIRK = decreased rate of depolarization
- Stimulated by the PNS
- Inward current carried by a non-selective cation channel called HCN (If)
- Allows flow of Na+/Ca2+ into cell
- Causes depolarization
- Increased If = increased rate of depolarization
- Stimulated by SNS
HR Modulation
Phase 4 Modulation
-
Parasympathetic (vagal) stimulation:
- Acetylcholine ⇒ muscarinic Ach receptors ⇒ increased IGIRK ⇒ K+ exits ⇒ hyperpolarization ⇒ decreased rate of phase 4 depolarization ⇒ decreased HR
- negative chronotropic effect
- trace C below
-
Sympathetic stimulation:
- Norepinephrine/epinephrine ⇒ β1 adrenergic receptors ⇒ increased If and ICa2+ ⇒ Na+ and Ca2+ entry ⇒ increased phase 4 depolarization ⇒ increased HR
- positive chronotropic effect
Diastolic Resting Potential and/or Threshold Modulation
-
Parasympathetic stimulation:
- Makes diastolic resting potential more negative
- Increases threshold
- Reduces firing rate
-
Sympathetic stimulation:
- Makes threshold more negative
- Increases firing rate
Latent Pacemakers
SA node: ~ 100 bpm
Other regions of the heart are capable of pacemaker activity:
AV node: 40-60 bpm
His/Purkinje fibers: 30-40 bpm
The pacemaker with the fastest rate of phase 4 depolarization and shortest AP controls HR = overdrive suppression.
Latent pacemakers can drive heart rate if SA node rate suppressed or latent pacemaker rate becomes faster than SA node = ectopic pacemaker.
(Ex. MI or ischemia causes decreased ox phos/ATP, reduced Na+/K+-ATPase, reduced ionic gradient, partial loss of -5mV provided by pump)
Impulse Propagation
Impulse conduction velocity depends on the rate of depolarization (Phase 0) of AP in that region.
- AP in atria, ventricle, and His/Purkinje system fast.
- AP spreads almost simultaneously due to gap junctions.
- Acts as a functional syncitium.
- AV has the slowest conduction velocity.
- Provides a delay between atrial and ventricular AP’s.
- Allows time for the ventricles to fill after atrial contraction.
- Important in effective pumping.
AV Node
Modulation
ANS can alter the conduction velocity of the AV node:
- Sympathetic stimulation increases conduction velocity = positive dromotropic effect
- NE/Epi ⇒ β1 Ad-R ⇒⇒ Inc. ICa2+ ⇒ Inc. AV velocity
- Parasympathetic stimulation decreases conduction velocity = negative dromotropic effect
- Ach ⇒ M-AchR ⇒⇒ Inc. IGIRK ⇒⇒ Dec. AV velocity
Cardiac Ion Channels
EKG
Basic Rules
- A wave of depolarization traveling towards a positive pole gives a positive voltage deflection.
- The size of the deflection is proportional to the mass of the tissue involved in the depolarization/repolarization event.
EKG Leads
3 bipolar leads: I, II, III
3 unipolar leads: aVL, aVF, aVR
6 precordial leads: V1-V6
Lead 1
Positive electrode records from the left side.
Negative electrode records from the right side.
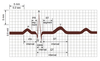
EKG Events
- AP generation at SA node not detected
-
P-wave = atrial depolarization
- Termination of P-wave when atria are completely depolarized
- Atrial repolarization obscured by ventricular depolarization
- Duration of P-wave reflects speed of propagation through atria
- PR-segment = reflects movement of AP through the AV node
- Q-wave = septal depolarization from left to right producing downward deflection
-
R-wave = AP spreading from the endocarium to the epicardium
- EKG trace upright because muscle mass of left ventricle > right ventricle
- S-wave = brief negative deflection due to upper part of ventricle depolarizing
-
QRS-complex represents the progression of ventricular depolarization
- Deflection returns to zero when entire ventricle depolarized
-
ST segment = plateau phase of AP when entirety of ventricular tissue depolarized
- Represents interval between depolarization and repolarization
-
T-wave = ventricular repolarization
- Repolarization proceeds from the epicardium to the endocardium producing a positive deflection
EKG Intervals
- P-P interval used to determine heart rate & rhythm
-
PR interval used to estimate how long it takes for AP to get through the AV node (and His/Purkinje system)
- PR prolongation indicative of abnormality in conduction pathway
-
QRS widening suggests that ventricle depolarization is slower than normal
- Found in cases of impaired conduction through the bundle of His = bundle branch block
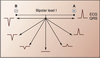
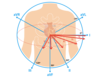
Mean Electrical Axis
(MEA)
The summation of the directions of electrical activity.
Certain cardiac abnormalities may alter the path of current flow through the heart changing the direction of the electrical axis.

Einthoven’s Triangle
Coordinate system allowing interpretation of the signals from various EKG leads in terms of the MEA.
When MEA is aligned with a lead the signal recorded will be maximally positive.
When MEA is perpendicular to a lead there is no deflection recorded in that lead = isoelectric lead.
Various leads can be used to determine the MAE.
Because the left ventricle is larger than the right ventricle, a normal MAE is between -30° (aVL) and +90° (aVF).
Axis Deviation
Pathophysiological conditions can alter the position of the MEA.
RVH means right side of the heart makes a greater contribution to total current flow causing QRS complex in lead 1 to be smaller than normal ⇒ right axis deviation.
(MAE beyond +100°)
LVH causes MEA to move more towards the left and aVF ⇒ left axis deviation.
(MEA more negative than -30°)
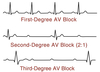
Heart Blocks
Decreased AV nodal conduction causes PR prolongation.
First-degree heart block:
Increased PR-interval but every P-wave is followed by a QRS-complex.
Second-degree heart block:
Worsening PR prolongation causes some P-waves to occur without subsequent QRS-complex.
Third-degree heart block:
AV nodal conduction completely blocked causing atria and ventricles to depolarize independently of each other. Ventricular contraction driven by a latent pacemaker.
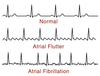
Atrial Arrhythmias
Pathologies can cause the atrial rate to exceed that needed to attain proper propagation through the AV node (250-350 bpm).
Atrial Flutter:
Not every P-wave is followed by a QRS-complex.
Atrial Fibrillation:
Atrial contraction driven by a number of local currents instead of the SA node resulting in uncoordinated atrial firing.
No P waves are detected.
Ventricular Arrhythmias
Ectopic pacemaker sites in the ventricle or re-entry circuits caused by abnormal propagation causes ventricular rate to exceed atrial rate.
Ventricular Tachycardia: HR 100-200 bpm
Ventricular Flutter: HR > 200 bpm
Both V-tach and V-flutter can lead to ventricular fibrillation where the electrical activity & pumping is completely uncoordinated.
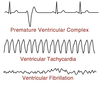
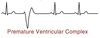
Premature Ventricular Complex
(PVC)
The heart is activated by a spontaneous AP in the ventricular cells leading to an abnormal QRS complex.
Myocardial
Ischemia & Infarction
- Ventricular repolarization is very sensitive to myocardial perfusion.
- Decreased perfusion can lead to alterations in the ST wave.
- ST elevations are only observed for first few days after myocardial infarct meaning they are indicators of recent injury.
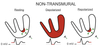
ST Depression
Represents mild to moderate deprivation of blood flow primarily affecting the subendocardial layers of the myocardium.
Causes region to have a higher than normal resting potential due to lack of Ox Phos, ATP, and Na+/K+-ATPase activity.
Interpreted by the lead as a wave of depolarization causing a higher than normal baseline.
ST segment appears depressed.
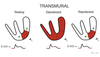
ST elevation
Associated with severe transmural deprivation of blood flow in subepicardial as well as subendocardial layers.
Causes entire ventricular wall to have a higher than normal resting potential.
Perceived by the lead as a wave of depolarization going away from it resulting in a lower than normal baseline.
ST segment appears elevated.
Systole
Period when the ventricle is contracting
Heart spends ~ 1/3 of its time in systole.
Diastole
Remainder of the cardiac cycle.
Includes relaxation and filling.
Cardiac Cycle
Ventricular Filling
- Blood enters left atrium from pulmonary vein (~ 10-15 mmHg)
- Left ventricle relaxed & expanding
- Ventricular pressure < atrial pressure
- Mitral valve opens
- Blood from left atrium ⇒ left ventricle
Atrial Contraction
- Atrial contraction (a-wave) follows P-wave of EKG
- Forces additional blood into left ventricle increasing ventricular pressure by additional 10-12 mmHg
- If atrium contracts against a stiffened ventricle, such as with LVH, an S4 (atrial gallop) occurs in late diastole
Ventricular Contraction
- Ventricular contraction follows QRS complex on EKG
- At systole onset, mitral valve open so atrial pressure increases
- As blood flows back into atrium the mitral valve closes = S1 heart sound
- Mitral valve bulges causing slight increase in atrial pressure = c-wave
- Ventricular contraction continues with both aortic & mitral valves closed = no change in volume ⇒ i_sovolumetric contraction_
- When ventricular pressure > aortic pressure (~80 mmHg) the aortic valve opens
- Blood from ventricle to aorta ⇒ rapid ejection
- Aortic & ventricular pressures continue to rise
Ventricular Relaxation
- [Ca2+] decreases ⇒ ventricular relaxation begins ⇒ pressure starts to drop
- Blood continues to enter aorta at slower rate ⇒ reduced ejection
- When ventricular pressure < aortic pressure the aortic valve closes = S2 heart sound
- S2 can be split into A2 and P2 if pulmonic valve closes after aortic valve
- More pronounced with deep inspiration
- S2 can be split into A2 and P2 if pulmonic valve closes after aortic valve
- Ventricle relaxation continues with closed mitral & aortic valves ⇒ isovolumetric relaxation
- Blood enters left atrium from pulmonary vein with closed mitral valve ⇒ atrial pressure increases
- When atrial pressure > ventricular pressure the mitral valve opens
- As ventricle fills atrial pressure drops producing “v-wave”
-
S3 (ventricular gallop) may be heard during ventricular filling
- Normal in children due to supple ventricle
- Abnormal & indicative of dilated cardiomyopathy in adults
-
S3 (ventricular gallop) may be heard during ventricular filling
Right-side follows a similar cycle but requires less pressure.
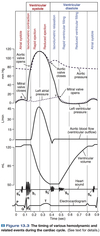
Aortic Pressure
- Aortic pressure oscillates between ~ 80 mmHg to ~ 130 mmHg normally
- Due to aortic compliance
- Provides a constant pressure gradient allowing continuous blood flow in systemic circulation
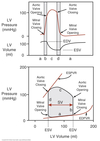
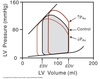
Pressure-Volume Loop
Events
Segment a:
- Mitral valve opens & blood enters ventricle.
- Slight pressure drop initially due to continued ventricular relaxation.
- Ventricle continues to fill with minimal change in pressure due to ventricular compliance.
- Volume after filling = end diastolic volume (EDV)
Segment b:
- Ventricular contraction begins causing increased pressure and mitral valve closes.
- Isovolumetric contraction occurs.
Segment c:
- When ventricular pressure > aortic pressure, aortic valve opens.
- Blood enters aorta as contraction continues = rapid ejection phase
- Ventricular relaxation begins but blood still being ejected = reduced ejection phase
- When ventricular pressure < aortic pressure, aortic valve closes
- Ventricular volume after contraction = end systolic volume (ESV)
Segment d:
- Isovolumetric relaxation occurs.
- When ventricular pressure < atrial pressure, mitral valve opens.

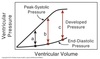
Pressure-Volume Loop
Interpretation
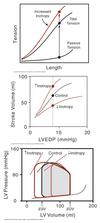
End Diastolic Pressure-Volume Relationship
(EDPVR)
- represents passive filling of the ventricle
- indicative of the passive length-tension curve of the ventricle
End Systolic Pressure-Volume Relationship
(ESPVR)
- represents the maximum pressure that can be developed for any given ventricular volume.
- indicative of the active length-tension curve of the ventricle
Stroke Volume
SV = EDV - ESV
Ejection Fraction
EF = SV / EDV
Work done by the heart is proportional to the area of the loop.
Preload
- The load aka blood volume present before contraction has started
- Represents ventricular stretching prior to contraction
- Set by the extent of filling
- Provided by the venous return
- Higher CVP = larger preload
- Increasing end-diastolic volume (EDV)
- produces little change in passively-developed pressure (end-diastolic pressure)
- has a significant effect on the actively-developed pressure during systole
- Due to Lo
Starling’s Law
Within physiological limits, the larger the volume of the heart, the greater the energy of its contraction and the amount of chemical change at each contraction.
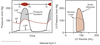
Cardiac Muscle
Length-Tension Relationship
Resting length = end-systolic volume
The optimal length is greater than the resting length.
Maximal force is generated at the point where the ventricles have filled.
Effects of Preload
- Increasing preload _increases end diastolic volum_e but has no effect on aortic pressure
- Causes widening of the pressure-volume loop to the right
- Results in increased SV and EF
- Leads to increased CO
Excessive Preloading
- Increasing preload is used as a compensatory mechanism for heart failure in order to maintain cardiac output.
- Chronic excessive preloading leads to increased ventricular volumes causing greater ventricular wall stress.
- Wall stress is a major determinant of myocardial O2 demand leading to ischemia and subsequent infarction.
- Wall thickness increased in order to counter-act wall stress leading to cardiac hypertrophy.
- Makes ventricular filling more difficult.
Law of LaPlace
σ = P x r
2h
σ = wall stress
P = pressure
r = chamber radius
h = wall thickness
Afterload
- The amount of force (aka pressure) that must be generated by the ventricle in order to move blood out of the heart and into the aorta.
- Defined as the wall stress (σ) present at peak systolic pressure.
- In the absence of aortic stenosis, afterload is very close to aortic pressure (PAo)
- Aortic pressure often used as a measurement of afterload.
Effects of Afterload
If afterload is increased:
- Can be a result of hypertension
- Heart must generate greater pressures to open the aortic valve
- Aortic valve will also close at a higher pressure
- Decreases fiber shortening velocity
- Slowing reduces the amount of blood ejected in a contraction decreasing stroke volume & ejection fraction
- More blood remains at the end of systole increasing ESV
- Venous return added to remaining volume causing a concurrent slight increase in EDV
-
Results in overall decreased cardiac output
- HR increased in order to compensate
- Leads to increased O2 demand
Aortic Stenosis
- Left ventricular emptying is impaired due to narrowing of the aortic valve
- Generates a murmur which can be heard between S1 and S2
- High aortic valve resistance = increased afterload
- Requires higher pressures to be generated by ventricular contraction
- In mild cases, sufficient CO can be generated.
- In severe cases:
- reduction in SV leads to drop in arterial pressure
- compensatory increase in EDV limited by ventricular hypertrophy associated with chronic afterload increase
- Can lead to a large increase in end-diastolic pressure associated with reduced end-diastolic volumes
Starling Curves
Represents the whole heart equivalent of the length-tension curve for isolated fibers.
Measure of cardiac function.
Pre-contraction length ≈ ventricular end-diastolic volume
Depends on the end-diastolic pressure.
Inotropy
The ability to modulate the degree of force generation in cardiac muscle contraction.
Controlled by the ANS.
Increasing inotropy ⇒ increases ventricular emptying ⇒ decreases ESV & EDV ⇒ increases SV & EF ⇒ increases CO
Slight decrease in EDV b/c venous return is being added to a smaller ESV.
Increasing inotropy:
Shifts the Starling curve upwards and to the left.
ESPVR curve is shifted left and becomes steeper.
Expands pressure-volume loop curve to the left
Blood Velocity
(v)
The distance that blood moves in a given time.
Units of cm/sec.
Blood Flow
(Q)
The volume of blood moved in a given time.
Unit of L/min.
Relationship of Blood
Velocity & Flow
Q = v x A
Q = blood flow
v = velocity
A = cross-sectional area
Equation of Continuity
Since the circulatory system is closed, the amount of blood moving through each class of vessel must be constant.
Qa = Qb = Qc
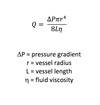
Poiseuille’s Equation
Describes fluid flow through a rigid pipe.
Applies more to arteries than veins due to venous compliance.
Pressure Effects
on
Blood Flow
Flow increases with increasing pressure.
Q œ Δ P
- Pressure gradient between aorta and vena cava drives flow through system
- Short-term increases in pressure effective in increasing blood flow
- Prolonged HTN bad
Vessel Radius Effects
on
Blood Flow
Small changes in vessel diameter can have significant effects on flow.
Q œ r4
- Resistance arterioles change vessel diameter to alter blood flow to specific tissues.
Atherosclerosis
Lipoprotein plaques cause decreased vessel radius.
Leads to decreased blood flow (Q).
ΔP has to increase to compensate ⇒ hypertension
Vessel Length Effects
on
Blood Flow
Flow decreases as vessel length increases.
Q œ 1/L
- Increased resistance to flow due to friction between blood and vessel wall
- No physiological role as length is constant
Blood Viscosity
Effects on Blood Flow
As viscosity increases, resistance to flow increases.
Plasma is 20% more viscous than water due to proteins.
As # of RBC’s (hematocrit) increases, viscosity increases.
Factors Affecting
Blood Viscosity
- Altitude
- Increases hematocrit (% RBC) to compensate for reduced oxygen availability
- Increases viscosity
- Polycythemia vera
- Pathological overproduction of RBC
- Increases hematocrit and viscosity
- Severe Dehydration
- Loss of plasma volume without decrease in RBC
- Increases viscosity
- Sick-cell anemia
- Decreased pliability of RBC
- Increases apparent viscosity
Resistance to Blood Flow
R = 8Ln/πr4
Series:
RTotal = R1 + R2 + R3
Parallel:
1 / RTotal = 1/R1 + 1/R2 + 1/R3
Total Peripheral Resistance (TPR)
aka
Systemic Vascular Resistance (SVR)
The sum of all the vascular resistances that lie between the aorta and the vena cava.
TPR = (MAP - CVP) / CO
Typically 15-18 HRU
(Hybrid Resistance Units or mmHg/L/min)
Pulse Pressure
PP = SBP - DBP
Increases as contractility or inotropy increases.
Mean Arterial Pressure
(MAP)
MAP = DBP + PP/3
Because heart only spends 1/3 of the cardiac cycle in systole.
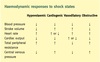
Shock
Clinical state in which tissue blood flow is inadequate for tissue requirement or oxygen utilization is impaired.
Most shock states are associated with an increase in TPR in an attempt to increase blood pressure.
Exception is distributive (septic) shock which is associated with a large drop in TPR.
Deviations from Poisuille’s Law
- Laminar vs turbulent flow
- Viscosity of blood changes with velocity
- Compliance of blood vessels
Streamline vs Turbulent
Blood Flow
- Streamline Flow
- Fluid experiences drag caused by friction between fluid and walls of the tube
- Velocity center > velocity edge
- Follows Poisuille’s law
- Turbulent Flow
- Flow patterns unstable and disorganized
- Can occur when blood forced through a constriction
- Velocity must increase to maintain flow
- No longer follows Poiseuille’s Law
- Greater pressure gradient required to maintain flow

Reynold’s Number
(NR)
Dimensionless number used to analyze flow through tubes.
Ratio of inertial forces (disrupt laminar flow) to viscous forces ( stabilizes laminar flow).
NR > 2,000 = turbulent flow

Korotkoff Sounds
Sound associated with partial occlusion of the brachial artery with a pressure cuff that reflects blood spurting at high velocity through the constriction.
Used to approximate systolic and diastolic blood pressures clinically.
Relative Viscosity
Slow moving blood shows greater apparent viscosity due to interactions of proteins and cells.
As velocity increases, cell-cell & cell-protein interactions are disrupted and viscosity decreases.

Vascular Compliance
Compliance = ΔV / ΔP
Arteries have low compliance so follows Poiseuille’s law more closely.
Veins have high compliance (capacitance vessels) so do not follow Poiseuille’s law.

Microcirculation
System of vessels with diameter less than 100 µm.
- Arterioles: 5 - 100 µm
- Resistance vessels
- High content of smooth muscle
- Metarterioles
- Provides bypass around capillary bed
- Less muscular
- Capillaries: 4 - 8 µm
- Facilitates exchange of nutrients, waste products, and gases
- Precapillary sphincter = on/off switch
- Post-capillary venules ⇒ Venules
- Thin walled
- Highly compliant
- No smooth muscle

AV Shunt
Ateriovenous Anastomosis
- Highly muscular
- Provides a path for blood to flow directly from arterial to venous system without entering the capillaries
- Mainly a mechanism for retaining heat

Transcapillary Exchange Pathways
-
Simple Diffusion
- Lipid soluble substances
- Gases
- Travels down concentration gradient
-
Bulk Flow
- Water, electrolytes, small molecules
- Diffusion through narrow passageways between adjacent endothelial cells
- Size/complexity of pores varies by tissue
- CNS with very tight junctions
- Liver, GI, kidney with wide gaps
- Driven by pressure difference
-
Pinocytosis
- Macromolecules
- Travel via vesicles
-
Facilitated diffusion or active transport
- Ions or small molecules

Capillary Classes
-
Continuous
- most common
- intercellular junctions between endothelial cells
-
Fenestrated capillaries
- Perforated
- Most often found surrounding epithelia
-
Sinusoidal (discontinuous)
- Large gaps between cells
- Found in liver

Capillary
Fluid Movement Forces
-
Capillary Hydrostatic Pressure (PC)
- ~ 35 mmHg at the arterial end of capillary
- ~15 mmHg at the venous end of capillary
- Facilitates blood flow through capillary bed
- Forces out water and salts into interstitium
-
Capillary Osmotic Pressure (πC)
- ~25 mmHg
- Caused by proteins/salts within the blood
- Albumin, globulins, fibrinogen
- Main driving force to retain & recover fluid from interstitium
- Capillary beds filter < 1% of fluid so fluid loss does not considerably change πC
-
Tissue Hydrostatic Pressure (Pi)
- Considered zero
- May actually be sub-atmospheric due to “sucking” action of lymphatics
-
Tissue Osmotic Pressure (πi)
- Normally a very small amount of protein leaks out causing ~ 1-2 mmHg
- Considered 0 because most returned via lymphatics
Starling’s Law of the Capillary
Relationship between the forces affecting capillary fluid flow and net fluid movement.
In healthy person, PC (outward) and πC (inward) are the main driving forces.
- Q = flow
- k = capillary membrane filtration constant
- tissue-specific
- accounts for surface area variations
- acknowledges differences in vascular permeability

Normal
H-Diagram
-
Net plasma osmotic pressure of ~ 25 mmHg
- Plasma oncotic (~27 mmHg)
- Tissue oncotic (~ 2 mmHg)
- Drives fluid from interstitium ⇒ blood
- Stable from one side of the capillary to the other
-
Arteriole side:
- Hydrostatic pressure ~ 35 mmHg
- Hydrostatic > osmotic pressure
- Water & solutes driven out of capillary
-
Venule side:
- Hydrostatic pressure drops to ~ 15 mmHg
- Osmotic > Hydrostatic pressure
- Fluid reabsorbed by capillary

Lymphatic System
- Lymphatic vessels are open at one end
- Undergo rhythmic contractions that suck fluid in
- Returns interstitial fluid into blood circulation

Renal
H-Diagram
- Blood enters glomerular apparatus at high pressures ~ 45 mmHg
- Large amounts of fluid filtered out into renal tubule
- Mechanisms to later recover components as needed
- Remainder leaves as urine

Pulmonary
H-Diagram
- Blood enters pulmonary capillaries at ~ 15 mmHg
- Hydrostatic pressure < oncotic pressure
- Pulmonary capillaries absorb fluid along their entire surface
- Prevents us from drowning in pulmonary secretions
- Fluid impedes gas exchange

CHF
H-Diagram
- Heart failure = decreased CO
- Unable to clear venous return
- Venous congestion increases pressure in venous system which is transmitted to capillaries
- Reduces capillary ability to reabsorb fluid
- Hydrostatic pressure does not fall below osmotic
- Net result of increased fluid being filtered into interstitium
- When lymphatic capacity exceeded edema occurs

Nutritional Edema
H-Diagram
- Plasma proteins catabolized
- Kwashiorkor-type malnutrition
- Lowers plasma oncotic pressure
- More fluid filtered out into interstitium
- Less fluid reabsorbed
- Fluid builds up mainly around midsection ⇒ ascites

Causes of Edema
-
Decreased plasma protein concentration
- Lowers plasma osmotic pressure
-
Arteriolar dilation
- Increases blood flow into capillaries
- PC greater ⇒ more fluid leaves
-
Venous obstruction
- Blood cannot flow through venous system
- Backs up upstream
- Results in increased PC
- More fluid leaks out
-
Histamine
- Increases capillary permeability
- Increases K from Starling’s law

Local Control
Capillary Blood Flow
Independent of CNS.
Depends on the state of the tissue.
Control at the level of precapillary sphincters, metarterioles, and small arteries.
-
Metabolic control
- More metabolism = more ATP demand = increased O2 demand
- Metabolites causing vasodilation of precapillary sphincters:
- adenosine
- lactate
- H+
- CO2 (from TCA cycle)
- K+
-
Myogenic Response
- Intrinsic mechanism of smooth muscle blood vessels
- Increased intravascular pressure leads to constriction
- Decreased intravascular pressure leads to relaxation
Central Control
Capillary Blood Flow
Mainly through the ANS and involves CNS.
Control at the level of precapillary sphincters, metarterioles, and small arteries.
-
Humoral Factors:
- Leads to vasoconstriction or vasodilation
-
Neural:
- Sympathetic NS
- Norepinephrine ⇒ constrict resistant arterioles.
- There is no intrinsic PNS input.
- Exogenous Ach can lead to vessel relaxation.
- Sympathetic NS
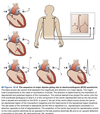
Coronary Circulation
- Coronary arteries begin at the root of the aorta via two ostia
-
Left coronary artery
- splits into the circumflex and left anterior descending arteries
- Right coronary artery
-
Left coronary artery
- Heart possesses many collateral circulations which are normally held closed
- Contains a dense capillary network

Coronary Blood Flow
-
Left-side
- During isovolumetric contraction, compression of the coronary arteries restricts blood flow to the left heart
- During diastole, myocardium relaxes and blood flow resumes
-
Right-side
- Not as muscular
- Minimal difference in flow between systole and diastole
- Blood flow relatively constant
- Coronary arteries enter from epicardium and go to endocardium
- Endocardium last to receive blood
- Compression of contraction also greatest in the endocardium
- Because of this endocardium most at risk for ischemia/infarction
- Heart extracts 75-80% of the oxygen from the blood
- Only way to meet increased oxygen demand is by increasing blood flow

Rate-Pressure Product
(RPP)
RPP = HR x Systolic BP
- Surrogate measure of myocardial O2 demand.
- Measured as myocardial O2 consumption (MVO2).
- Blood flow to the heart depends upon the work performed.
- Factors that increase HR or SBP causes heart to work harder:
- SNS activation
- HTN
- Increased blood volume
Coronary Blood Flow
Regulation
- Almost no CNS effect on blood flow
- Blood flow primarily determined by local control:
- Build up of metabolites cause vasodilation
- Adenosine (ATP breakdown product)
- Lactate (sign of anaerobic respiration)
- H+
- K+ (due to decreased [ATP] leading to decreased Na+/K+-ATPase activity)
-
Autoregulation (aka myogenic response)
- Over a range of pressures, heart will ensure that it has proper blood flow by adjusting vessel resistance as pressure changes
- When ΔP drops, decrease R via vasodilation to maintain Q.
- Build up of metabolites cause vasodilation
- When local control has maximized O2 supply to the heart the only treatment left is to decrease O2 demand
- Heart very intolerant of anaerobic respiration
- If blood flow is inadequate, hypoxia can lead to myocardial infarction or angina pectoris

Splanchnic Circulation
Overview
- Oriented both in series and parallel
- Organs of the GI system organized in parallel including a blood supply to the liver via hepatic artery
- Blood from GI organs enters the liver in series via portal vein
- Receives ~25% of cardiac output at rest
- Serves as a reservoir of blood
- Can increase markedly after a meal

Splanchnic Circulation
Regulation
Regulated by both local and central mechanisms:
-
Local control: minor mechanism
- Controlled by metabolites
-
Central control: major mechanism
- Enteric NS has as many neurons as the CNS combined
- SNS activation decreases blood flow to the splanchnic circulation
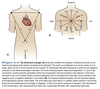
Intestinal Villi
Counter-current Exchange
- Structure of the counter-current exchange system sets up a gradient for O2 flow
- allows the venule to steal oxygen away from the ascending arteriole
- Normally there is enough oxygen to nourish the villi afterwards
- In low flow conditions (such as CHF)
- SNS activation results in decreased total blood flow to the intestines
- Can lead to anoxic injury of the villi
- Villi slough off resulting in decreased SA for absorption
- Leads to malnutrition (seen with end-stage CHF)

Cutaneous Circulation
Anatomy
- Subcutanous fat provides an effective insulating barrier
- Prevents heat loss to the environment in cold conditions
- But also retards loss of heat in warm environments
- Small vessels penetrate the fat and expand into numerous capillary hairpin loops immediately below the epidermis
- Capillary loops connect to an extensive venous plexus
- Allows heat exchange between the body’s core and external environment
- High surface area of capillaries
- Slow blood velocity
- Large temperature gradient between blood and external environment
- AV anastomosis allows blood to bypass capillary network thus conserving heat in times of cold

Cutaneous Circulation
Regulation
Under central control by SNS only:
- Core temperature decreases:
- SNS releases norepinephrine
- Leads to vasoconstriction
- Increases core temperature
- Core temperature increases slightly:
- SNS norepi release inhibited
- Leads to vasodilation by means of reduced vasoconstriction ⇒ passive vasodilation
- Large increase in core temp:
- SNS releases Ach
- Ach causes release of bradykinin and nitric oxide (NO)
- Leads to active vasodilation
- Allows greater heat loss
Skeletal Muscle Circulation
Overview
- Receives very little blood flow at rest with ~ 25% capillaries open
- Blood flow significantly increases during exercise/stress
- Due to large portion of body mass, is a major site of peripheral vasoconstriction
- Serves as a secondary pump
- Contraction/relaxation moves blood one way through veins
- Decreases venous pressure
- Aids in capillary perfusion
- Especially important during exercise
- Can contribute up to half of the pumping needed to support max blood flow during aerobic exercise

Skeletal Muscle Circulation
Regulation
Exhibits both local and central control:
-
Central control:
- SNS releases norepi
- Normally causes vasoconstriction while at rest
- Stimulates adrenal medulla to release epi during stress
- Epi lead to vasodilation via β2-adrenergic receptor
- SNS releases norepi
-
Local control:
- Vasodilation caused by metabolites
- Able to overpower SNS control during exercise or fight-or-flight
- Exhibits reactive hyperemia:
- Prolonged interruption of blood flow causes build-up of vasodilating metabolites
- When flow resumed, there is a marked increase in flow due to vasodilation
- Over time metabolites are removed and vascular resistance/blood flow return to basal levels
- Vasodilation caused by metabolites

Cerebral Circulation
- # 1 organ in blood flow hierarchy
- Very limited capacity for anaerobic respiration
- 20-30% decrease = lightheadedness
- 40-50% decrease = syncope
- Uses SNS to reduce blood flow to other organs when supply low to provide for cerebral flow
- Brain extracts maximal O2 from blood
- High capacity for autoregulation
- Relatively immune to CNS input
Blood-Brain Barrier
- Continuous endothelial cells connected via tight junctions
- Provides CNS protection from most blood-borne factors
- Transport into cerebral circulation:
- Trans-cellular route is the main mechanism for getting materials into and out of the capillaries
- Lipid soluble substances (EtOH) and gases (O2, CO2) easily diffuses through
- Glucose is an exception
- Transported by GLUT1
- Pinocytosis rare
Cerebal Autoregulation
Main mechanism for cerebral blood flow control:
Functions over wide range of pressures (60-130 mmHg).
Autoregulatory curve shifts to the right under chronic HTN to protect CNS over new range.
- Dependent mainly on partial pressure of CO2 and to a lesser extent O2
- CO2 is the most sensitive measure of metabolic demand
- Slight increase in PCO2 (sensed as changes in H+ levels) causes a large increase in cerebral flow
- Does not respond to decreases in PO2 until ~ 50 mmHg (last ditch effort)

Intracranial Pressure
(ICP)
- Brain lies in closed cranium
- Skull prevents increases in volume
- Brain essentially incompressible
- Changes in cerebral blood tend to be regional
- Matched by opposite changes in a different part of the brain
- Elevated ICP can result from bleeding, edema, or tumor
- Changes in ICP can have huge effects on cerebral perfusion
- Decreases perfusion pressure = decreased blood flow
- Causes veins to collapse

Cerebral Perfusion Pressure
(CPP)
CPP = MAP - ICP
Pressure gradient that drives blood flow in the CNS.
Renal Circulation
Anatomy
Receives ~20% cardiac output.
Highest by size of any organ.
- Afferent arterioles feeds the glomerulus at high pressures
- Glomerular capillaries are the site of filtration within Bowman’s capsule
- Efferent arterioles leave the glomerulus branching into peritubular capillaries
-
Peritubular capillaries surround the renal tubules
- involved in counter-current exchange
- Then form venules → veins which leaves kidney

Renal Blood Flow
Regulation
Shows both autoregulation and sympathetic control.
- Autoregulation occurs at afferent arteriole
- Major role during normal kidney function
- Systemic control via RAAS system
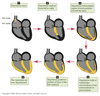
Variations in afferent and/or efferent arteriole resistance determines whether glomerular filtration or peritubular reabsorption is effected:
B:
Inc. Rafferent
Dec. pressure in glomerular capillaries → Dec. filtration
Dec. pressure in peritubular capillaries → Inc. Absorption
D:
Inc. Refferent
Inc. pressure in glomerular capillaries → Inc. filtration
Dec. pressure in peritubular capillaries → Inc. absorption

Blood Flow Control
Summary Table

Short-Term
BP Regulation
- used to compensate for pressure changes associated with shifting activity patterns
- involves autonomic reflex loops consisting of:
-
Pressure sensors (baroreceptors)
- monitor arterial pressure
-
Integrator (cardiovascular center)
- determines whether pressure too high or too low
-
Effector pathways (SNS)
- Adjusts pressure as needed
-
Pressure sensors (baroreceptors)

High Pressure Baroreceptors
(Arterial)
Measures stretch of blood vessel walls:
-
Carotid sinus
- Located at fork of carotid arteries
- Glossopharyngeal nerve to CN IX
- Provides info on cerebral blood flow
- More sensitive
-
Aortic baroreceptors
- Located at aortic arch
- Vagus nerve relays signals via CN X
- Provides info regarding blood flow in the entire CV system

Low-Pressure Baroreceptors
(Cardiopulmonary)
- Located within the atria and pulmonary artery.
- Important in reporting info about blood volume, venous return, CVP
A receptors
- In atrium: sense atrial wall tension during contraction
- report on HR
- In pulmonary artery:
- controls circulating blood volume
- indirectly affects BP
- triggers release of hormones that change water secretion/reabsorption
B receptors
- sense atrial stretch during filling
- fires after contraction
- report on atrial volume

Baroreceptor Signaling
- Receptors respond to rate of pressure change as well as MAP
- Baroreceptors stretch as transmural pressure increases
- Results in more frequent AP
- Rate & timing of AP’s convey info

Cardiovascular Center
Located within the nucleus tractus solitarius (NTS) of the medulla oblongata.
Two distinct regions control CV activity:
-
Vasomotor Center
- Activates vasoconstrictor & positive chronotropic/inotropic response
- Acts via SNS
- Inhibited by NTS
- High BP = off
- Low BP = on
-
Cardioinhibitory Center
- Activates vagal outputs to the heart
- Decreases HR
- Acts via PNS
- Stimulated by NTS
- High BP: on
- Low BP: off
- Activates vagal outputs to the heart

Baroreceptor Effectors
-
Blood Vessels
- Sympathetic control (norepi)
- Used by vasomotor center
- Arteries: vasoconstriction → inc TPR → inc BP
- Veins: vasoconstriction → inc VR → inc PL → inc BP
- Exception: skeletal muscle
-
SA/AV nodes
- sympathetic (norepi) & parasympathetic (Ach)
- SA:
- SNS: inc If → inc rate of phase 4 depol → inc HR
- PNS: inc IKAch → dec rate of phase 4 depol → dec HR
- AV:
- SNS: inc ICa++ → inc phase 0 rate → inc conduction velocity
- PNS: dec ICa++ → dec phase 0 rate → dec conduction velocity
-
Myocardium
- sympathetic (norepi)
- inc ICa++ → inc Ca++ entry → inc CICR → inc intropy
- inc velocity of H/P system due to inc. density of Na+ channels
- inc conduction through ventricular myocardium
-
Adrenal medulla
- sympathetic (norepi)
- medulla releases epi and norepi into blood
- whole body effects
- Heart: epi acts like norepi
- Vascular: epi acts on skeletal muscle beds → vasodilation
- Lungs: bronchodilation
- Eyes: increase vision
Adreneric Receptors
Receptor distribution, receptor density, and intraceullar signaling pathways allow for different effects from the same molecule.

Baroreceptor Reflex
Upon Standing
- Immediately after standing blood pools from the central compartment into the venous compartment
- Dec VR → Dec PL → Dec CO
- Decreased CO sensed by baroreceptor as drop in BP
- Baroreceptor reflex initiated
- Reduced firing rate of receptor causes:
- Disinhibition of vasomotor center → activation of SNS → inc HR/SV/TPR
- Decreased stimulation of cardioinhibitory center → decrease PNS → release of PNS “brake” on SA node
- Net result of BP increase
- peripheral vasoconstriction → inc TPR
- increased HR
- increased inotrophy

Baroreceptor Reset
Prolonged exposure to elevated pressures causes range of pressure over which the baroreceptors respond to shift towards higher pressures.

Vasoactive Substances
Affects vascular smooth muscle contraction and relaxation.
Affects BP and distribution of blood flow.
Endocrine or paracrine action.
Changes TPR.
Biogenic animes:
norepi/epi
serotonin
histamine
Peptides:
Angiotensin II
Atrial natriuretic peptide (ANP)
ADH/AVP
Endothelins
Non-vasoactive substances
Target organs outside the CV system.
Mostly involves ways to modulate effective circulatory volume.
Includes:
epinephrine
serotonin
histamine
Angiotensin II
ANP
ADH
Vasoactive Biogenic Amines
Summary
-
Epinephrine
- Binds to alpha-1 receptors on vascular smooth muscle cells
- Causes vasoconstriction
- Binds to beta-2 receptors on skeletal muscle vessels
- Causes vasodilation
- Binds to alpha-1 receptors on vascular smooth muscle cells
-
Serotonin
- Local mediator
- Causes vasoconstriction
-
Histamine
- Released by mast cells/basophils in response to tissue damage
- Causes vasodilation
Vasoactive Peptides
Summary
-
Angiotensin II
- potent vasoconstrictor
- controlled by RAAS system
-
Atrial natriuretic peptide (ANP)
- released by atrial myocytes in response to low pressure baroreceptor stretch
- vasodilator
-
ADH/AVP
- released from posterior pituitary
- vasoconstrictor activity at high concentrations
- affects water reabsorption by kidneys at low concentration
-
Endothelins
- released by endothelial cells
- Type A receptors:
- on smooth muscle cells
- leads to vasoconstriction
- Type B receptors:
- on endothelial cells
Juxtaglomerular Apparatus
- High pressure baroreceptors located on afferent arterioles which enter the nephron
- Senses changes in systemic blood volume
- Effects granular cells ability to secrete renin
- Decreased BP = increased renin release
- Drop in BP also sensed by carotid baroreceptors which stimulates SNS & results in renin release

Renin-Angiotensin-Aldosterone System
(RAAS)
- Juxtaglomerular apparatus senses drop in BP stimulating release of renin from granular cells.
- Carotid sinus via SNS also stimulates release.
-
Renin cleaves angiotensinogen into angiotensin I
- Ang I is a weak vasoconstrictor
- Angiotensin I converted to angiotensin II by angiotensin converting enzyme (ACE)
- ACE secreted by renal and pulmonary endothelial cells
-
Ang II:
- very potent vasoconstrictor
- regulates synthesis and secretion of aldosterone
- Aldosterone increases Na+ reabsorption by kidney resulting in subsequent water retention
- stimulates thirst (dipsogenic effect)
- stimulates ADH release
- The net effect is increased arterial pressure by increasing TPR & blood volume.

ADH
-
Circumventricular organ contains osmoreceptors which sense plasma osmolarity.
- Hyperosmolarity triggers depolarization and increase in frequency of AP
- Stimulates secretion of ADH
-
Atrial and pulmonary baroreceptors active when BP normal or high.
- Inhibits ADH secretion
- Increases urination and volume loss
- Drop in BP deactivates baroreceptors and results in ADH secretion (secondary mechanism)
- Requires 10% volume loss
-
ADH function:
- stimulates renal collecting ducts to insert AQP2 allowing increased water reabsorption
- at higher concentrations has vasoconstrictor activity
- both result in increased BP

Atrial Natriuretic Peptide
(ANP)
- Atrial myocytes synthesize and store ANP.
- Myocardial stretch sensed by the cardiopulmonary receptors as sign of increased venous return and high circulating blood volume.
- ANP release stimulated.
- ANP antigonizes effects of Ang II.
- Inhibits aldosterone/ADH secretion
- vasodilatory action
- Net effect is to reduce BP

Aldosterone
- Primarily released in response to increased plasma levels of Ang II or potassium.
- Acts on distal tubules to retain water by reabsorbing Na+ back into blood stream
Nitric Oxide
(NO)
Release
NO made from arginine.
-
Bradykinin, Ach, shear stress, and others factors stimulate constitutive endothelial NO synthase (ecNOS)
- High blood velocity = high demand = high shear stress
- Endothelium protects itself from damage by generating NO leading to vasodilation
- Inc SA = dec velocity
-
Endotoxins and cytokines stimulate inducible NO synthase (iNOS)
- Causes massive NO production leading to huge TPR drop, BP drop, and shock
Nitric Oxide
Mechanism
- NO activates guanylyl cyclase which makes cGMP
- cGMP activates PKG (& other things)
- PKG inhibits MLCK & activates SERCA Ca2+ pump → smooth muscle relaxation → vasodilation
Nitrates & Angina
- Nitroglycerin or amyl nitrate given which breaks down into NO.
- NO dilates resistance vessels and decreases TPR & afterload.
- Mainly acts as a venodilator which decreases preload.
- Reduces stroke volume & CO leading to decreased myocardial oxygen demand.
- Protects heart from further damage.
Long-Term BP Control
Summary Diagram

Venous Structure
- Thinner & more compliant walls allow veins to accomodate ~ 70% of the blood volume in the body.
- At maximal fill levels, collagen resistant to further filling.
- SNS stimulation causes venoconstriction pushing blood into arterial circulation.
- Does not follow Poisuille’s law due to compliance
Orthostatic Reflex
- Upon standing, CVP decreases as blood moves into the venous reservoir of the legs.
- Causes a loss of preload and cardiac output.
- Lowers SBP
- HR increases in an attempt to restore CO.
- TPR increases in an attempt to restore preload.
- Increases DBP
- Most changes reversed with movement which turns on accessory venous pumps.

Mechanisms to Restore CVP
-
Skeletal muscle pump
- contraction squeezes veins increasing venous return
-
SNS stimulation from cardiovascular center
- Venoconstriction due to SNS stimulation causes blood to shift from venous to arterial side
- Minimal increase in venous pressure but allows for faster blood flow & increased preload
- SNS increases HR and inotropy - sucks blood from venous compartment generating a negative pressure
- Increases pressure gradient between capillaries and atrium
-
Increase in blood volume
- Chronic changes associated with the kidney
Mean Circulatory Pressure (MCP)
aka
Mean Systemic Pressure (MSP)
aka
Mean Systemic Filling Pressure (MSFP)
- When the pump is turned off (CO = 0), arterial and venous pressures are equal = MCP/MSP/MSFP
- Depends on blood volume and vessel compliance of the entire system
- Does not equal MAP
- As CO increases, blood pulled from venous system and pushed into arterial system.
- Arterial pressure increases
- Venous pressure decreases

Cardiac and Vascular
Function Curves
-
Cardiac function curves (Starling curve) - A
- Describes the effect of CVP (i.e. preload, EDFP, EDV) on CO
- Looks at the pump
- Can be altered by changing the inotropic state of the heart
-
Vascular function curve - B
- Describes the effects of CO on CVP
- Looks at the plumbing
- Can be changed by altering blood volume or arteriolar tone
These two curves combined describes a phsyiological state which explains both the pump and pipes = Guyton Curve.

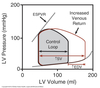
Guyton Curve
Superimposed vascular and cardiac function curves.
Equilibrium point where curves intersect defines the relationship between cardiac and vascular function.
CV system functions at this equilibrium point until one or both curves shift.

Inotropic
Cardiac Function Curve
Increased inotropy shifts the curve upwards.
Ex. increased SNS stimulation
Decreased inotropy shifts the curve downwards.
Ex. CHF or MI

Blood Volume
Vascular Function Curve
Curves shift according to the apparent amount of blood in the venous system.
Hypervolemia or increased venous tone:
Shifts the vascular function curve upwards.
Results in increased MCP which is dependent on blood volume.
Ex. venoconstriction
Hypovolemia or decreased venous tone:
Shifts the curve downwards.
Decreases MCP.
Ex. massive blood loss, severe dehydration, venodilation

Arteriolar Dilation
Vascular Function Curve
- Changes in arteriolar tone has no effect on MCP because very little blood in the resistance arterioles.
- Arteriolar dilation does change the slope of the vascular function curve.
- Decreases in resistance = decreased afterload ⇒ makes it easier for the heart to eject a given SV for any given venous pressure.
- For any given filling pressure:
- decreasing afterload will slide the curve up.
- increasing afterload will slide the curve down.

Changes in Inotropy
Establishes a new equilibrium point defined by the intersection of the new Starling curve with the old vascular function curve.
Increased inotropy shifts the Starling Curve upwards and to the left.
(A⇒E)
CVP drops because blood is moving from veins to arteries at a faster rate.
Decreased inotropy shifts the Starling Curve down and to the right.
(A⇒D)
CVP increases because blood is no longer cleared as efficiently from the venous compartment.

Changes in Blood Volume
Changes in blood volume results in a parallel shift in the vascular function curve.
Increased blood volume ⇒ increased MCP ⇒ increased preload ⇒ increased CO without changes in inotropy
(A ⇒B)
Decreased blood volume ⇒ decreased MCP ⇒ decreased preload ⇒ decreased CO without changes in inotropy
(A⇒C)

Changes in Arteriolar Resistance (TPR)
Increased arteriolar resistance ⇒ increased TPR ⇒ increased afterload ⇒ decreased CO
(A⇒B)
Decreased arteriolar resistance ⇒ decreased TPR ⇒ decreased afterload ⇒ increased CO
(A⇒C)
As TPR increases the pressure drop between arterial and venous circulation grows.
Increasing TPR results in a lower CVP for any given CO.

Heart Failure
Guyton Curves
Heart failure results in decreased cardiac output.
(A⇒D)
Short term:
SNS increases inotropy and moves Starling curve back up.
(D⇒A)
Long term:
Increased blood volume via renal system shifts to a new vascular function curve.
(D⇒F)

Respiration
- Inspiration results in more negative pressure in the thorax:
- Increases pressure gradient between atrium and capillaries ⇒ increases venous return to right heart.
- Both chambers of right heart increase in volume due to increased outward transmural pressure.
- Inhalation distends capillaries in the lung:
- Reduces pulmonary pressure
- Decreases blood flow to left ventricle.
Inhalation:
Increased PL & SV in right heart
Decreased PL & SV in left heart
Exhalation:
Increased PL & SV in left heart
Decreased PL & SV in right heart

Valsalva Maneuver
Straining against a closed glottis.
- Straining increases intrathoracic pressure.
- Aorta compression
- Increased aortic pressure
- Baroreceptor senses this as an increase in BP
- Vena cava compression
- Decreased venous return
- Baroreceptor reflex decreases SNS activity
- Decreased HR
- If straining prolonged, CVP increases enough to cause backward blood flow reducing CO.
- Aorta compression
- Compression reduces VR
- CO decreases
- Aortic pressure drop activates baroreceptor reflex
- SNS inhibition relieved
- HR increases
- Maneuver stopped and breathing resumes.
- Aorta compression reduced
- Transient drop in aortic pressure
- Baroreceptor reflex causes a further increase in HR
- Aorta compression reduced
- Intrathoracic pressure returns to normal.
- Vena cava compression relieved
- VR suddenly increases to a heart under SNS stimulation
- Causes a rapid increase in CO & aortic pressure
- Baroreceptor reflex triggered
- PNS output increases
- HR decreases

Static Exercise
Sustained contraction towards the voluntary force limit by muscles that are held at constant length.
(Isometric)
-
Contraction causes compression of blood vessels within the muscles ⇒ increases TPR
- __DBP increases as a reflection of TPR
- CV system responds by increasing BP in an attempt to overcome TPR and maintain blood flow.
- Change in BP is proportional to the size of the muscle involved & intensity of the contraction.
- SBP increases as a reflection of CO
- BP spike made worse by the Valsalva maneuver typically associated with straining.
- Increases aortic pressure
- Decreases venous return
- MAP shows significant increase
- Upon relaxation, blood surges into oxygen-starved tissues.
- High ΔP
- Due to central SNS output
- Low TPR
- Muscles stopped squeezing
- Local control due to build up of metabolites leads to vascular dilation
- High ΔP
- Rapid & significant drop in arterial pressure.
- Poor cerebral circulation.
- Risk of syncope
- Poor cerebral circulation.

Dynamic Exercise
Rhythmic cycles of contraction and relaxation involving isotonic muscular activity.
1) Anticipatory Phase
- Manipulation of the cardiovascular center by the cerebral cortex results in an anticipatory increase in CV performance
2) Exercise
-
Local = skeletal muscle
- Metabolites build up as muscles contract causing vasodilation.
- Flow enhanced by:
- pressure gradient across the capillary bed
- recruitment of capillaries previously inactive
- Pre-capillary sphincters regulated by local metabolite concentrations
- Dilation of resistance vessels causes TPR to drop.
- Allows for enhanced flow from aorta to systemic circulation
-
Central: sympathetic NS
- Muscular contraction activates sensory nerve fibers in skeletal muscle sending impulses to the cardiovascular center increasing SNS response.
- Inc. HR
- Inc. inotropy
- Adrenal medullary release of epi/norepi
- Skeletal muscle vasodilation
- Flow to non-critical organs diverted
- Venoconstriction to increase blood volume/VR/PL
Heart Rate
During Dynamic Excercise
Increased SNS output and withdrawal of PNS from SA node results in increased HR.
High venous return due to skeletal muscle flow & venoconstriction makes up for the decreased time available for ventricular filling with elevated HR.
Increase in HR actually required to accommodate the additional preload.

Inotropy
During Dynamic Exercise
Sympathetic drive directly increases cardiac inotropy via neural inputs to the ventricular myocytes.
SNS indirectly increases inotropy through adrenal medulla release of epi/norepi.
Inc. HR results in an additive increase of residual [Ca2+] in myocytes increasing inotropy ⇒ Bowditch staircase / treppe phenomenon.
Blood Shunting
During Dynamic Exercise
- Skeletal muscle blood flow increases from 1.2 L/min at rest up to 25 L/min during exercise.
- Coronary flow increasing.
- Flow restricted to non-essential organs such as the splanchnic system, kidneys, and non-working muscle.
- Skin blood supply transiently decreased but restored within minutes then increased x3-4 to dissipate heat.
- During intense exercise blood flow to the skin decreases again in order to support CO.

Venous Return
During Dynamic Exercise
- SNS stimulates venoconstriction causing:
- blood mobilization
- increases VR
- decreased venous capacity
- increases velocity of blood returning to heart
- blood mobilization
- Skeletal muscle acts as an accessory pump
- Provides as much as 50% during exercise
- Deep inhalation generates greater negative pressures in thorax amplifying the pressure gradient
- Aids in blood flow from the microcirculation to the thorax
- Increases VR
- Brings in more oxygen
- Aids in blood flow from the microcirculation to the thorax

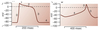
Static vs Dynamic Exercise
Summary
Static Exercise
- Sustained contraction leads to increased TPR.
- Marked elevation in blood pressure occurs through increased cardiac output & inotropy.
- Significant increase in MAP.
- Minimal change to pulse pressure as both DBP & SBP increase.
- Rapid drop in pressure occurs upon relaxation ⇒ near-syncope.
Dynamic Exercise
- Characterized by a pronounced increase in CO that results largely from an increase in HR.
- Tendency for high HR to decrease SV offset by enhanced VR and increased inotropy.
- SV increases up to 40% of resting.
- Aortic pressure markedly increased to drive enhanced CO towards working muscles.
- TPR falls due to peripheral vasodilation.
- Leads to a pronounced widening of pulse pressure.
- MAP changes to a small degree.

Strength Training
Repetitive static exercise has little CV benefit.
- High SBP and MAP produced during isometric contraction presents a high afterload to the heart → hypertrophy results.
- Ventricular wall thickens to counter effects of wall stress.
- Fibrils laid down in parallel.
- Decreases intraventricular volume.
- EDV may actually be decreased by training.
- Parallel hypertrophy pushes coronary capillaries apart and decreases efficiency of O2 delivery.

Endurance Training
Aerobic training has a number of CV benefits.
- Wall thickening limited to the septum.
- Ventricular walls increase in mass to accommodate increased workload but fibrils laid down in series so myocytes become elongated.
- Enlarges the ventricular cavity which increases SV by as much as 50%
- Pushes CO towards 35 L/min compared to 20-25 L/min
- At rest, lower HR required to achieve basal CO of 5 L/min.
- Wider range of HR achievable
- Able to maintain CO with a smaller change in HR
- Increased vasculature through angiogenesis
- Occlusive events likely to have less drastic consequences for myocardium

VO2 Max
VO2 max = COmax x (PO2 arterial - PO2 venous)max
The limit to exercise resides mainly in the CV system and the ability of muscles to extract O2.
Untrained individuals can increase VO2 max by 8-15 fold.
Atheletes can achieve a 20 fold increase due to:
- Cardiac hypertrophy
- Training modifies the body’s ability to carry and use O2
Muscle Effects
of
Endurance Training
Increases the percentage of slow fibers in muscle thereby increasing O2 usage.
Increase in capillary density within muscles allows for extraction of greater amounts of O2 from the blood.
Increases overall muscle mass.
Blood Volume Effects
of
Endurance Training
Endurance training raises blood volume by ~ 12%.
Enhances preload and facilitates increased CO.
Helps offset plasma volume loss through exercise-induced sweating.
Lipid Profile Effects
of
Endurance Training
Training increases HDL levels & reduces triglycerides.
Decreases risk factors associated with coronary heart disease.
Age Effects
on
Cardiovascular System
The body’s ability to exercise declines by 8-10% for every 10 years.
Impairs virtually every step in O2 uptake, delivery, and usage.
An active lifestyle can significantly offset and delay decline.
- Lungs:
- reduced capacity and surface area for gas exchange
- loses elasticity
- respiratory muscles slowed
- O2 dissociates from Hb less readily which restricts availability
- Decrease in maximal HR
- Body compensates by increasing SV through PL and EDV
- Cardiac efficiency declines
- Decrease in overall vascular compliance
- Elastin → collagen
- Decreased baroreceptor sensitivity
- Loss of muscle mass
Cardiac Stress Testing
Exercise Stress Test
- Treadmill test while on an EKG.
- As exertion increases, CO must increase to meet demands.
- Any impediment to coronary blood flow results in ventricular ischemia ⇒ ST depression.
Pharmacological Stress Test
Dobutamine (β-AR agonist) used to increase HR, inotropy, and BP.
Can be done in conjunction with echocardiogram to evaluate for heart abnormalities.
Autonomic Nervous System
Characteristics
- Modulates the visceral organs
- Primarily involved in maintaining homeostasis
- Parasympathetic vs sympathetic divisions
- Each pathway consists of a presynaptic & postsynaptic neuron

Parasympathetic Nervous System
(PNS)
- Craniosacral outflow
- Long preganglionic fibers
- Release Ach which act at nicotinic receptors
- Short postganglionic fibers
- Release Ach which act at muscarinic receptors
- Actions terminated by acetylcholinesterases
- Overall function of PNS is to conserve energy
- Enhances digestion

Sympathetic Nervous System
(SNS)
- Short preganglionic fibers originate from thoracic & upper lumbar spine
- Synapse on paravertebral & prevertebral ganglia
- Can synapse with many post-ganglionic fibers = stimultaneous activation of multiple organ systems
- Release Ach which acts at nicotinic Ach receptors
- Long postganglionic fibers
- Release norepi acting at alpha & beta adrenergic receptors
- Exception is sweat glands where Ach acts at muscarinic receptors
- Release norepi acting at alpha & beta adrenergic receptors
- Actions terminated by reuptake and degradative enzymes
- Overall function is to mobilize body for activity
- Operates at low basal levels to continuously modulate organ function

Acetylcholine
- Synthesized from choline and acetate by choline acetyltransferase
- Release from vesicles triggered by Ca++
- Inhibited by botulinum toxin
- Acts at nicotinic or muscarinic receptors
- Degraded by acetylcholinesterase
- Defect in enzyme results in desensitization

Norepinephrine
-
Synthesis
- Tyrosine converted to DOPA by tyrosine hydroxylase
- DOPA converted to dopamine by decarboxylase
- Dopamine conerted to norepi by dopamine-beta-hydroxylase
- In adrenal medulla, norepi converted to epi by PNMT
-
Termination
- Reuptake primary mech for norepi
- Degradative enzymes
- Monoamine oxidase (MAO)
- Catechol-O-methyltransferase
Pulmonary Innervation
SNS → Norepi → β2 AdR→ bronchodilation → enhanced air movement
PNS → Ach → M2 AchR→ bronchoconstriction → decreased air movement
Cardiac Innervation
SNS → Norepi/Epi → β1 AdR
SA node: + chronotropic effect → inc HR
AV node: + dromotropic → inc conduction
Myocytes: + inotropic → inc force of contraction
PNS → Ach → M2 ChR
SA node: - chronotropic effect → dec HR
AV node: - dromotropic → dec conduction
Myocytes: no innervation
Impaired Chronotropic Response
Failure to achieve 85% of age predicted maximal HR.
Increases mortality rate.
Vascular Innervation
SNS:
-
α1 AdR: skin & viscera - vasoconstriction
- norepi & epi
-
β2 AdR: skeletal muscle - vasodilation
- epi
PNS:
No vascular innervation.
Exogenous muscarinic drugs will cause vasodilation
Eye Innervation
Pupil
-
Dilator radial muscle
- Controlled by SNS
- α1 receptors
- Leads to dilation
-
Constrictor circular muscle
- Controlled by PNS
- M3 receptors
- Light reflex triggers PNS
- Leads to constriction
Ciliary Muscle: controls lens
- SNS through β2 receptors
- Causes relaxation
- Far vision
- PNS through M3 receptors
- Causes contraction
- Near-vision (accomodation)
Liver Innervation
SNS releases norepi.
Binds β2 receptors.
Causes increased glucose release.
Fight or Flight
Response
SNS release of norepi/epi leads to coordinated response:
- Vasoconstriction of visceral capillary beds
- Vasodilation of skeletal muscle capillary beds
- Increased HR, AV conduction, inotropy
- Bronchodilation
- GI tract & bladder relaxation
- Pupillary dilation, far vision
- Skin to sweat
- Glycogenolysis/gluconeogenesis by liver for energy
