Week 2 Flashcards
(15 cards)
Random Experiment:
procedure whose outcome cannot be predicted in advance with certainty. E.g. toss a coin twice
Probability of an event happening:

Sample space
all the possible outcomes of an experiment
Sample Point
just one of the possible outcomes
Foundations of Probability
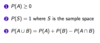
Associated with each event A in S is the probability of A, P(A) which satisfies:
Independent event example:
knowing that B occured brings no information on the probability of A
Conditional Probability

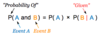
Probability of event A and B
Random variable definition
a set of possible values from a random experiment.
Mass or density function of a random variable
Every random variable has a probability function such that each realization may occur with some probability.
For instance, the realizations of a “roll a dice” random variable have probability 1/n, where n is the number of faces.
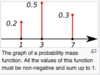
Probability Mass Function
a function that gives the probability that a discrete random variable is exactly equal to some value.
Probability Density Function
a function, whose value at any given sample (or point) in the sample space (the set of possible values taken by the random variable) can be interpreted as providing a relative likelihood that the value of the random variable would equal that sample.
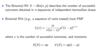
Bernoulli distribution
Binomial
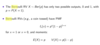
Z score formula
Simply put, a z-score is the number of standard deviations from the mean a data point is. But more technically it’s a measure of how many standard deviations below or above the population mean a raw score is. A z-score is also known as a standard score and it can be placed on a normal distribution curve. Z-scores range from -3 standard deviations (which would fall to the far left of the normal distribution curve) up to +3 standard deviations (which would fall to the far right of the normal distribution curve). In order to use a z-score, you need to know the mean μ and also the population standard deviation σ.