Water Conservation Practitioner III Flashcards
What influence demand forcast?
Population
Weather
Program Saturation
What does the Certification Grade III cover?
- Integrated Planning - a broader perspective
- Program Design
- Program Monitoring
- Program Evaluation
- Program Cost-Effectiveness
- Rate design
- Drought Planning and Management
WUE Grade 3: Need Need-To -Know Criteria
- Program Design

NPV
NPV is higher indicates project or investment is more attractive. Dual water supply systems is highest NPV . WC is lowest.
WUE Grade 3: Need Need-To -Know Criteria
- Program Monitoring

WUE Grade 3: Need Need-To -Know Criteria
- Program Cost-Effectiveness Analysis/Issues
/

WUE Grade 3: Need Need-To -Know Criteria
- Program Design

Water Planning in California - years
Since 1993 UWMP
Since 2002 IWRMP: integrated Water Resource Management Plan
Since 2014: Groundwater Sustainability Plan
What does water planning look like in California?

Integrated Resource Planning parts
- Integrated Resource Planning – For Your Agency
- Analyzing Water Supply Reliability
- Comparing Total Cost of All Supply Options
- Include Water Use Efficiency In Water Portfolios
What are the general categories of Integrated Resource Planning?
- • Integrated Resource Planning – For Your Agency
- • Analyzing Water Supply Reliability
- • Comparing Total Cost of All Supply Options
- • Include Water Use Efficiency In Water Portfolios
What does Analyzing Water Supply Reliability look like?
Analyzing Water Supply Reliability
–Current and future water supply reliability
–Normal, Dry and Critical Dry Year reliability
–Impacts from different Water Use Efficiency scenarios
–Timing of future reliability investments
How do you compare Total Cost of All Supply Options
–Water use: annual, seasonal, monthly and daily by sector
–Saturation of conservation measures during planning period
–Capital and operation costs, comparison tools
Comparing Total Cost of All Supply Options
Include Water Use Efficiency In Water Portfolios
–Assess other water agency programs
–Consider CUWCC Best Management Practices
–Address local water use targets
Include Water Use Efficiency In Water Portfolios
– Assess other water agency programs
– Consider CUWCC Best Management Practices
– Address local water use targets
Water Policy Coordination
California: [Plans updated every five years]
State Water Plan (with water portfolios) Integrated Regional Water Management Plans Groundwater Sustainability Plans
GSPs
Urban Water Management Plans
Water Loss Control (DWR/SWRCB)
Drinking Water Compliance
Groundwater Cleanup
State Water Plan – 2018 Update
Managing Water Resources For Sustainability
The California Water Plan (Water Plan) is the State’s strategic plan for sustainably managing and developing water resources for current and future generations
Required by California Water Code Section 10005(a), plan presents status and trends of state’s water-dependent natural resources; water uses and supplies; and future agricultural, urban, and environmental water demands and supplies for a range of plausible climate and socio-economic scenarios.
Statewide Applied Water Use - how water was used … in millions of acre-feet

Statewide Dedicated and Developed Water Supply - where it came from … in millions of acre-feet

M50 Definition
A comprehensive long range resource management approach that considers least cost analyses of demand and supply side management options, stakeholder input, and water resource alternatives that address utility, environmental and societal costs and benefits.
IRP (Integrated Resource Planning): AWWARF Definition
IRP is a continuous process that results in the development of a comprehensive water resource management plan.
IRP: California DWR Definition
a comprehensive plan for a defined geographic area, the specific development, content, and adoption of which shall satisfy requirements developed pursuant to this part. At a minimum, an Integrated Regional Water Management Plan describes the major water-related objectives and conflicts within a region, considers a broad variety of resource management strategies, identifies the appropriate mix of water demand and supply management alternatives, water quality protections, and environmental stewardship actions to provide long-term, reliable, and high-quality water supply and protect the environment, and identifies disadvantaged communities in the region and takes the water-related needs of those communities into consideration.
IRP: Model Process

Traditional vs. IRP Approach

Traditional vs. IRP Approach

Urban Water Demand Forecasting More Important Than EverL wHAT IS THE PURPOSE?
– Sizing water system and new water supply
– Sizing/staging treatment & distribution system improvements
– WUE Program tracking and evaluation
– IMPORTANT for WUE targets and program design
– System operations management and optimization
– Water rate setting, revenue forecasting, and budgeting
AWWA 2013: Demand Forecasting: What is unique and difficult about Demand Forcasting?
• “Water demand is inherently difficult to forecast because water is a complex, multidimensional commodity.”
“Each water system has a unique set of data; there is no single model that can fit all systems.”
Future Urban Water Supplier Water Use Targets (SB606/AB1668)

SWRCB Policy: Indoor Use standard reduced from ___ to ___
55 gpd in 2020 and 42 in 2030
Urban Retail Water Supplier’s Urban water use objective:
Aggregate efficient indoor residential water use
Aggregate efficient outdoor residential water use
Aggregate efficient outdoor irrigation with dedicated irrrigation meters
Aggregate estimated efficient water losses
Aggregate estimated water use for variances approved by the State Water Board
Allowable bonus Incentive Adjustments: (CWC 10609.20(d)): which shall be limited in accordance with one of the following:
- volume of potable reuse water from existing utility with, completed environmental review by Jan 1st, 2019, that becomes operational by Jan 1st, 2022, not to exceed 15% or urban water use objective
- volume of potable reuse water from new facility, not to exceed 10% of urban water use objective
Urban Retail Water Supplier’s Urban Water Use Objective, Adjusted for Bonus incentive . . .
for annual reporting purposes & comparison to the actual water use in the previous year.
Tendency: Overestimate Demands

AWWA 2013: Importance
• The Importance of Water Demand for Operations and Planning
• Water demand and resultant water sales represent a water system’s economic engine. Demand projections form the basis of several complex financial and strategic decisions including capital investments.
– Based on daily/seasonal system flow projections
– Short term (1-5 yrs.) vs. long term (15+ yrs.) horizon
– Asset Management decisions – capacity, R&R
AWWA 2013: Forecast Considerations

CA State Water Project
Water Supply Reliability Perspective

CA State Water Project Estimated Future Exports

IRP: Emerging Areas

IRP: Context
California:
State Water Plan (updated every five years) Integrated Resource Water Management
- About 50 planning regions state-wide
- Now GSA regions with GSPs…
Nevada:
State Water Plan (Nevada Revised Statute 540) Integrated Water Management
Typical IRP (IRWMP) - CA
- Executive Summary
- References
- Section 1 - Introduction
- Section 2 - Region Description
- Section 3 - Existing & Future Conditions
- Section 4 - Water & Land Use Planning
- Section 5 - Challenges & Opportunities Summary
- Section 6 - Goals & Objectives
- Section 7 - Resource Management Strategies (Incl. WUE)
- Section 8 - Project Review & Prioritization
- Section 9 - Impacts & Benefits
- Section 10 - Coordination
- Section 11 - Implementation Framework
- Section 12 - Acronyms & Glossary
IRP: Policy Coordination
California:
State Water Plan (updated every five years) Integrated Regional Water Management Plans Urban Water Management Plans (every five years) Water Portfolio Documentation
Water Conservation Plans WCP
SB 606/AB 1668
–Water Use Targets
2013 Draft California Water Plan Comparison of Water Management Options - (San Diego Area – 2010)

Metropolitan Water District 2010 IRP Dry Year Resource Goals

Bay Area Water Users Demands

Bay Area Water Users Water Use Efficiency Targets
PEIR is Program Environmental Impact Report
WCIP is water conservation implementation plan**

Southern Nevada Water Authority: water sources and porfolio.
• Nevada Water Sources
– 60% surface water (all surface water allocated)
– 40% groundwater (local and regional)
• SNWA Water Portfolio
– Colorado River surface water allocations
– Groundwater (continue developing)
– Planning for lower gpcd water use efficiency target

2009-13 SNWA Conservation Plan: THE ROLE OF CONSERVATION IN RESOURCE PLANNING
Water conservation plays a critical role in water-resource planning and management. The ability to increase efficient water use and reduce water waste has a direct impact on the amount of resources that will be needed in the future. The more successful a community’s conservation, the lower the community’s projected demand for water (relative to levels that would have occurred in the absence of conservation) becomes.
Sample Water Portfolio – Long Term

Sample Water Portfolio -2020

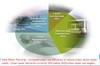
RP: Water Option Evaluation (NPV)

Water Source Diversification Is Here: ex. City of Santa Barbara

Recycled Water An Expanding Part of State Water Portfolio…
State
wide recycled water production
increased from about 500,000 afy in
2003 to 714,000 afy in 2015. New
recycled water projects are being
added to the recycled water portfolio
on an on going basis.
Recycled Water An Expanding Part of State Water Portfolio…

Cost Comparison Methodologies
- Annualized Costs – Annualized Capital/O&M Costs – Application: ranking projects based on utility costs
- Net Present Value (NPV) – Current and future costs and benefits – Discount rate (expected future inflation rate) – Ranking projects based on current value
- Benefit/Cost (B/C) – Measure of project economic feasibility
- Internal Rate Of Return (IRR) – Means of screening project economic feasibility
Sample: Annualized Costs
Assumptions:
––$5 million capital costs
–6% interest rate
–40 year project useful life
Annualized Capital Costs= $332,308
Annualized O&M Costs= $250,000
Total Annualized Costs= $582,308
•Simple method for comparing similar projectsces for different projects
Sample: Net Present Value
• Assumptions:
– Future value
– Discount rate
– Periods ranging from year 1 to project useful life
Method for selecting preferred projects and allocating limited resources for different projects
Sample: NPV Calculation

NPV = (Present Value of Cash Inflows) - (Present Value of Initial Investment + Present Value of O&M Costs)
Sample: Benefit/Cost Ratio
Assumptions:
–Present value of benefits
–Present value of costs
–Discount rate
–Generally: B/C ratio > 1 (feasible)
Alternative method for determining the economic
feasibility of a resource option.
Sample: B/C Calculation

Sample: Internal Rate of Return
Assumptions:
–Present Value (PV) equation
–Set PV to zero
–Discount rate
–Calculate rate of return vs. other alternatives
Alternative method for screening projects for
economic feasibility (not for ranking projects).
Discount Rate (Rate)
- Influential on PV/NPV calculations
- Should reflect either
– Best alternative use of available funds or
– Cost of capital (rate on long term debt)
Rate
– High: future values diminish more quickly
– Low: future values diminish less quickly and have greater influence in present value calculation - Other Perspectives
– Utility (based on long term tax exempt bonds)
– Society (based on Treasury bonds)
– Ratepayer (based on rate of return for investments)
CA Statewide Urban Water Use: Eight-Year Average, 1998-2005:
Water Use Efficiency – Sample Costs

Discount Rate (Rate)

IRP: In Summary
• Accepted planning approach: dynamic process
• Evaluate All Options – Supply Alternative & WUE Scenarios
• Select Best Options – multiple considerations
– Utility
– Society
– Rate Payer
• Water Use Efficiency
– Incorporated into the long-term water portfolio
– Included in regional water management planning
– Considers further reductions in per capita water use
– Drivers: regulation, technology, programs, utility practices
PROGRAM DESIGN parts
• Knowledge and interpretation of Conservation Program Designs
– Other water agency programs
– CUWCC Best Management Practices
– Local water agency water use targets
• Understanding Criteria To Design Programs
– Past Conservation Program efforts
– Assessment of current service area data and characteristics
– Water use impacts from regulations
– Future water use targets
– Program costs and benefits
• Identify potential savings in your area
– By sector
– Saturation of conservation measures
– Assess annual, seasonal and monthly water use patterns
• Design based on where savings need to be realized
– Indoor vs. outdoor uses
– Utility system improvement potential
– Sector focus
– Regulation impacts
Program Design – Framework

Program Design
EPA Water Conservation Plan Guidelines
Program design can be part of a water utility’s water conservation planning process.
WUE Program Design Process

Program Design
AWWA Residential End Use Study Updates
AWWA Residential End Use Study 1999 vs. update in 2016 indicating declining residential water use trends to consider in program design as part of a water utility’s water conservation planning process.
Program Design
AWWA Residential End Use Study Updates
AWWA Residential End Use Study 1999 vs. update in 2016 indicating declining residential water use trends to consider in program design as part of a water utility’s water conservation planning process.
What should be considered when you are designing a program?
– Understand current Program
– Account for local water use targets
– Assess other Programs
– Consider BMPs
– Identify utility system potential
– Document regulation impacts
– Technology (AMI, leak detection, etc.)
Program Design – Target Approaches

Map of CA - Average Baseline Water Use

CA-GPCD Baseline Water Use (2010)

California Water Plan 2020 Projected Savings

Urban Water Demand Forecasting.
What are the basic steps to estimate a water demand model?

Urban Water Demand Forecasting
What are the key parameters that can impact forecasts?

Urban Water Demand Forecasting
Accurate forecasting = optimal WUE Design

Urban Water Demand Forecasting
Accurate forecasting equals optial design
- Surface Water
- Groundwater
- Outdoor Savings
- Indoor Savings
URBAN WATER DEMAND FORECASTING: Surface, Groundwater and charts to show future;

Program Design – Future WUE Target
What are the sample future water use targets?

SNWA WUE Target
86 GPCD by 2035

California Urban Water Conservation Council Best Management Practices

Program Design - Time
• Toilets (2014: 30%+ still have high use models)
– 1992 1.6 gpf new construction standard
– Rebate Programs statewide since 1980s
– 2011 Green Code Standards
• Showers (2014: 80%+ saturated)
– 1992 Federal Energy Act changes
• Clothes Washer (2014: 50%+ ? Saturated)
– State BMP
– Rebate Programs statewide since 1990s
• Leaks (2014: 30%?, AMI deployment dependent)
• Outdoor Savings (2014: 30%?, programs/rates)
2013 SNWA WUE Program
Water Pricing/Other Influence Coefficients

2013 Contra Cost Water District Comprehensive Program

Estimated Indoor Residential - CA Water Uses (2000)

Program Design – Sample Screening

Program Design – Screening Criteria

Program Design - Utility
• System metering practices/AMI deployment
• System leak detection and repair program
• Effective main flushing program
• Customer leak/high user notification program
• Agency facility water management program
– Indoor
– Outdoor
• Water rates: conservation-oriented rate structure
• Utility billing: online access water use history
• System pressure regulation
Program Design - Regulation
• California Green Code Standards
• Urban Water Management Planning Act
– Residential indoor and outdoor use, water loss control
• DWR Model Water Efficient Landscape Ordinance
– 0.7 to 0.55 Evapotranspiration water budget
• SWRCB Water Loss Control Performance Standard
• SBx7.7/SB606-AB1668
• Funding Program criteria (e.g. SWRCB)
• Incorporate into final program design
CA Residential End Use Study (2008) – 12 agencies

Consider Demand Hardening - Lower WUE Targets – Tougher Savings - Where does your water utility stand?

Program Design Sample Selection Criteria

Program Design - GPCD – Selection Impacts

Program Design. what additional information should you look at?
- Customer feedback
- Expert feedback
- Survey results
- Adequate resources for marketing/outreach
- Program budget adequacy
- On track to meet long term water use targets
Program Design-Final Determination
- Selection criteria results
- Budget/funding outlook
- Water use target status
- Process/schedule for program approvals
- Staffing/program support
- Other factors: drought, revenue reliability
Program Design - Schedule
• Plan development/approval (1 year)
• Implementation (1-5+ years)
• Impacts by staff/support service levels
• Regional planning processes
• State laws/regulations/requirements
• Regulatory Reporting – SWRCB/DWR
• Timing of rate adjustments (1+ year)
– Single or multi-year increase
S101: Program Implementation
• Formal Adoption of Plan
• Budget
• Prioritization
– Based on Board/Council approvals & preferences
– Staff limitations: need to hire staff/consultants
– Timing and sequencing considerations for measures
– Cash flow
• Schedule
– Major milestones and deadlines
– Timing of Plan development and approval
– Budget approvals and Board/Council timing
– Internal and external funding/financing processes
• Other Considerations
– Agreements and partnering
– Adoption of local ordinance/codes/policies
– Training
Program Design - Options

Program Design - Adjustments
• May require additional process with stakeholders
• Board/Council approvals
• Budget adjustments
• Programmatic
– More/less targeted approach
– Changes to marketing/outreach efforts
– Customer/political support
Program Design - Continuous
- Evaluate programs annually
- Modify program design as needed to meet targets
- Design new programs if necessary
- Consider more targeted program designs
What do you monitor as you are running a Program?
• Knowledge of methods and issues involved in planning for and developing and implementing drought management plans and policies
– Identify drought triggers and thresholds
– Importance of pre-planning/design for response to future drought conditions
– Mid course corrections during droughts
– Involvement of stakeholders
Program Monitoring. What is your knowledge of methods and issues involved?
• Knowledge of methods and issues involved in monitoring conservation programs
– Identify models
– Water Utility specific metrics
– Importance of pre-planning/design
– Mid course corrections
– Involvement of stakeholders
Types of Program Monitoring/Follow-up
Tracking program impacts
Meeting WUE targets
Program costs: actual trakcing with planned
Customer acceptance
Regulatory compliance: meeting RC parameters

Monitoring – Primary Approaches
• Specific End Use Calculations
– Document each measure by customer
– Assign account levels savings for each measure
– Doesn’t account for changes in other uses
• General Per Capita Water Use Calculations
– Focus on overall per capita water use levels
– More emphasis on total program water use impacts
– Some individual account/sector validation needed
Monitoring Approach – Key Data
End Use
Specific account information
Accurate documentation of measures Additional metered data preferred (e.g. AMI) Identified end use water saving assumptions
- ex. replace 1 or 2 toilets
Per Capita
Total water supply
Total water demand
Population served
Programmatic savings estimate information
Tracking Program Impacts
• Water Supply Data
– Monthly, seasonal, annual water deliveries
• Water Demand Data
– Monthly, seasonal, annual demands
– By sector
– Program participants vs. status quo customers
– Annual per capita water use trends
• Program participation levels
– Rebates, surveys, leaks, landscape changes
• Marketing/outreach efforts
– Cost/timing/effectiveness
Monitoring Approach – Key Data

Monitoring – Annual Production

Monitoring – By Sector
Monitoring – Monthly Data

Monitor other than water
Monitor wastewater flows if was indoor fixtutes

Changes In Water Demand
- Weather/population related
- Programmatic savings
- Behavior-based water use changes
- New customer standards – indoor/outdoor
- Long term vs. short term demand changes
- Gray water/rain harvesting
Monitoring – Savings Reliability

Monitoring – How do you Account For Trends
Population
– New construction: more efficient water use
– Growing number of ‘aging in place’ households
– Other demographics
Development
– Slower growth rates
– Overall smaller lot sizes/less outdoor use per acct.
– More mixed-use development
Monitoring - Customer Target
• “All Customers” Mostly low users (< median use)
– Already conservation minded
– Retrofit/survey program participants
– Lower beginning water usage levels
– Low water savings potential
• “Targeted” Mostly higher users (> avg. use)
– Pre 1993 accounts for indoor retrofit programs
– Larger lot sizes/turf dominated landscapes
– Historically low program participation
– Higher beginning water usage levels
– Higher water savings potential
Monitoring - Sampling

Residential Indoor Use Drivers

123S: Average Indoor Residential Use Data

Monitoring – Weather/Climate
Monitoring – Weather Impacts

Monitoring – Weather Impacts
Compare seasonal/annual data)
Water Budget Indices – WUCOLS Study

End Use Calculations

Estimate: Existing Penetration of Low Flow Plumbing Devices, City of Davis

Monitoring – Annual GPCD Trend

Monitoring – GPCD By Sector

Monitoring – GPCD Targeting

“WUE Account” – EPA Water Sense

Metered Water Use Data
• Understand reading/billing cycle
• Different periods represented (not ‘monthly’)
• Typically Available Monthly Data
- Water production data (normally daily)
- Weather data (normally daily)
- Demand data (can be variable)
- Demand data not synchronized with production
• Synchronize production/demand/weather data
Trace Wizard: Measuring End Uses

Single Family Residential Monitoring

Sample Program Monitoring
Toilet Replacement – goal 100% by 2025

Sample Monitoring
Toilet Replacement Program
• Accurate Accounting of Replacements
– By installation or rebate date
– By Sector
– By Type (1.28 gpf, dual flush, other)
– Regional vs. local program accounting
• Be Consistent throughout Program Period
– Document any changes in Program monitoring practices (keep apples-to-apples accounting)
Monitoring – Budget/Costs
Program Budget
– Recommended budget
– Authorized budget
– Budget adjustments
– Capital funding
– Funding timing and contributions
• Program Costs
– YTD tracking for major cost categories including program and human resources (staff, consultant
services)
– Over/under budget: opportunities for enhancing program participation
– Re-allocation to meet annual program goals
Monitoring – Capital Costs
Typical Funding/Financing Sources
– Long term tax-exempt bonds
– SRF funding (SRF)
– State grant funds (match)
– Private placement (third party)
* Securing Sources
– Can take several years
– May require timely/commensurate rate increases
– May be required to implement certain WUE measures
Monitoring – Sample Program Costs

Monitoring – Costs
Establish Separate Accounting System
– Labor
– Contracts
– Materials
– Rebate disbursements
– Marketing/Outreach
– Training
– Other expenses
• Monitor Program Costs
– Monthly
– Quarterly
– Annually
Cost Management
Rebate Funds
– Not meeting participation targets (under budget)
– Exceeding participation targets (exceeding budget)
• Planning/Regulatory Costs
– Periodic Plan updates (local, regional)
– State mandated planning
– Compliance with funding programs
– Compliance with BMP reporting/requirements
– Membership/outside organization costs
• Timing of budget/program authorizations
• Marketing/Outreach – additional efforts required
Customer Acceptance
Rebate Programs
– Rebate program (like/dislike)
– Rebate amounts (too low/high)
– Customer costs too high
• Marketing/Outreach
– Feeling ‘targeted’
– Encouraging program participation
– Perception of ‘waste of public dollars’
– Keeping up with social media/Gen Y
– Diversified approach may be needed
• Per Capita Water Use Targets
– Pro: clear message on goal; Con: perceived as regulatory
– Increases premium on customer water demand data
• Water Rates
– Program acceptance can rest with rates
Regulatory
• Urban Water Management Plans – next due 2025
– Water agencies with at least 3,300 connections
– Annual use at least 3,300 afy
– Every five years (0 and 5)
• WUE Inclusion in Regional Water Planning
– IRWMPs/Other regional efforts
• Compliance
– Green Code Standards
– State new construction landscaping laws
– Related laws/regulations
• State Funding – may have WUE requirements
Categories of Water Conservation Program Monitoring
• Develop Monitoring Framework
– Units and metrics
– Short vs. long term
– Review and interpretation
• Do What Works Best For Your Water Utility
– Prioritize and right size your monitoring efforts
• Periodically Update Monitoring Parameters
– In accordance with UWMP updates
– Based on available utility information
– Use technology to automate the process
• Monitoring – It’s Up To You!
What is the purpose of evaluating programs?
• Purpose:
– To evaluate all considerations in finalizing a water conservation plan that meets all goals and objectives.
Program Evaluation: methods and issues involved in
evaluating conservation programs
• Knowledge of methods and issues involved in
evaluating conservation programs
– Identify models
– Importance of pre-planning/design
– Mid course corrections
– Involvement of stakeholders
Evaluate Best Way To Meet
Your Water Use Target

S152: Evaluation Process On-going

Three basic perspectives that should be considered in the Benefit/Cost evaluation:
Water utility
Utility Customer
Community
S155: Benefit/Cost Evaluation-Analysis

Benefit/Cost Evaluation
- Common Utility screening tool for WUE evaluation process
- Benefits/Costs = benefit cost ratio
- B/C ratio: >=1.0 is considered feasible
- Compute present worth of time stream of benefits and costs
- Can add qualitative benefits as percentage bonus (e.g. environmental, socioeconomic)
S158: Benefit/Cost Evaluation-Analysis
- One tool for assessing water conservation measures that best meet Agency water use goal
- Balance short & long term water savings impact
- Consider measures from utility, customer and community perspectives
Typical Benefits and Costs
• Reduced water purchase costs
• Reduced O&M costs (energy, chemical)
• Reduced/deferred treatment plant capital costs
• Reduced water storage costs
• Reduced wastewater processing costs
• Other capital cost savings (downsizing)
• Cost of WUE programs
– Implementation costs
– Reduced revenue cost impacts to utilities
– Customer costs
• Qualitative
– Environmental
– Socioeconomic
– Other
Estimating Benefits/Costs - Sample
• Cost Savings From Reduced O&M Expenses -Energy
– VUCE = [AEC – (12 x MFEC) – (ECNP)] / UWU
VUCE = variable unit cost of energy
AEC = annual energy bill
MFEC = monthly fixed charges for energy
ECNP = energy costs not related to water production UWU = annual units of water used
Estimating Benefits/Costs - Sample 1
• Cost Savings From Reduced Purchase of Water
AWC = UPW x UCPW
AWC = annual water cost
UPW = units purchased annually UCPW = unit cost of purchased water
• Cost Savings From Reduced O&M Expenses - Energy
VUCE = [AEC – (12 x MFEC) – (ECNP)] / UWU VUCE = variable unit cost of energy
AEC = annual energy bill
MFEC = monthly fixed charges for energy
ECNP = energy costs not related to water production UWU = annual units of water used
• Cost Savings From Reduced O&M Expenses - Chemicals
– VUCC = [ACC – CCNP] / UWU
VUCC = variable unit cost of chemicals ACC = annual chemical bill
CCNP = chemical costs not related to production UWU = annual units of water used
– AWC = UPW x UCPW
AWC = annual water cost UPW = units purchased annually UCPW = unit cost of purchased water
Evaluation – Sample Program Costs

Evaluation – Annual Progress

S172: Program Evaluation - Considerations
- Recent rate increase (larger than normal)
- Drought conditions
- Program saturation levels
- Local and regional program/incentive levels
- Impact from new development/code changes
Program Evaluation – AWWA Survey

Program Evaluation - Forecasts
• Typical Water Demand Forecast Estimate Methods
– Regression Generated Confidence Intervals
– Risk or Monte Carlo Simulation
– Alternative Scenarios
• Water Rates
– Current rates
– Future Rates
– Impacts on long term WUE efforts
– Impacts on revenue forecasts
Chart which shows Evaluation or program – Forecast Summary

Program Evaluation - Forecasts
• Forecast Evaluation Methods
– Means Squared Error (difference between predicted & actual)
– Means Absolute Deviation (equal weight the errors)
– Mean Absolute % Error (for each measured error)
– Bias (amount/direction of avg. estimated value from avg.)
• Water Rates
– Current rates
– Future Rates
– Impacts on long term WUE efforts
– Impacts on revenue forecastss
Program Evaluation – Improving Forecasts
• Evaluate Past Forecasting Results
– Reveal size and pattern of past forecast errors
– Suggests ways to improve updated forecasts
– Compare prior forecasts with actual events
• When Uncertainty About Future Is Great
– Average alternative forecasts of future water use
– Develop a range of outcomes using several scenarios
– Weigh costs/benefits of improving forecasts
Program Evaluation – Improving Forecasts
• Revenue Forecasting Challenges
– Updating of rates to reflect changing demands
– Inflection points for changes in rate structure
– Actual vs. planned WUE program implementation
• Dealing With Future Uncertainty
– Average alternative forecasts of future water use
– Develop a range of outcomes using several scenarios
– Consider likely changes in demands (e.g. Green Code)
Program Evaluation – Formal Forecasts
• Improving Demand/Revenue Forecasting
– Formalize approach
– Basis for continuous update process
– Develop better (not perfect) forecast evaluation tools
• Other Considerations
– Availability of detailed demand/revenue information
– Independent forecasting function
– Account for utility operating policies and programs
– May/may not agree with management expectations
Program Evaluation – Survey Methods
• Sources Of Information
– Customer Feedback (current & prospective customers)
– Expert Opinion (local leaders/consultants/others)
– Sample Surveys
– Combine with other topics (e.g. water quality)
• Customer Survey Approaches
– Mail
– Telephone
– Online/social media
– Concern: non-responsiveness
Program Evaluation – Improving Methods
• Better Information
– Customer feedback/surveys
– Expert opinion
– Updated utility/customer information
• Regular Updating
– Use Formal Forecast Model(s)
– Continuous evaluation
– Calibrate approach/modeling tools on a regular basis
Program Evaluation – Improve Forecasting
• Account For Significant Events
– City of Santa Barbara lingering severe drought impacts
– 1987-1992 drought forever impacted demands
– Annual Demands (pre-drought) = 17,000 afy
– Annual Demands (today) = 11,000 afy
• Account For Regulatory Impacts
– New construction (water efficient) accounts
– Pre-1993 account retrofitting schedule
– Likely future changes in per capita water use
City of Santa Barbara - Demands
• The 1987-92 Drought Changed Demands Forever!

City of Santa Barbara – Future Demands

City of Santa Barbara - Demands
• Evaluating Future Demands To 2030

CA – CIMIS Weather Map

Evaluate Weather Variations
Davis, CA CIMIS Station Data
July Comparison

Program Evaluation – Other Factors
• Utility
– Availability of accurate program information
– State of technology/computer systems
– Staffing levels/consultant support
– Changes in leadership
• Regulatory
– Actively implementing all regulations
– All relevant programs/policies/codes up-to-date
– Accurate records and documentation
Program Evaluation – Other Factors
• Conservation vs. Other Options
– Water re-use
– Desalination
– Water marketing/transfers
– New surface/groundwater supplies
• Conservation Reliability
– Proven reliance on long term conservation target
– Rate changes over time (+/-)
– Maintaining public/political support for investments
– Premium on more accurate forecasting
Program Evaluation – Other Factors
- Local Program Comparison
– Other agencies
– Regional
– State
– Federal - Funding/Financing Availability
– Local (rates)
– Regional cost-sharing
– State (SRF [State Revolving Fund], Propositions, Other)
– Federal (WRDA [Water Resources Development Act], CVPIA [Central Valley Project Improvement Act], Infrastructure, Othe
Cost Effectiveness
There is an old saying that water flows
uphill to money.
Providing a safe reliable water supply is typically
based in part on the cost-effectiveness of the
preferred water portfolio.
Cost-Effectiveness definitions
• Knowledge/Process Involved In Determining Cost-Effectiveness
– Determining Avoided Cost
– Present worth cost-effectiveness analysis
– Benefit/Cost ratio of program or device
– Water Savings
• Issues and Methods To Determine Avoided Cost
– Capital Costs
– Operational Costs
– Administrative Costs
– Timing of future reliability investments
• Cost-Benefit Ratio
– Basis for ratio
– Assessing reliability of projected costs and benefits
– Savings Decay
– Natural Replacement
– Life of Measure
• Review/Approval Process
– Involvement of stakeholders
– Importance of external “ peer” review
Cost-Effectiveness
• Knowledge/Process Involved In Determining Cost-Effectiveness
– Determining Avoided Cost
– Present worth cost-effectiveness analysis
– Benefit/Cost ratio
– Water Savings
• Issues and Methods To Determine Avoided Cost
– Capital Costs
– Operational Costs
– Administrative Costs
– Timing of future reliability investments
• Cost-Benefit Ratio
– Basis for ratio
– Assessing reliability of projected costs and benefits
– Savings Decay
– Natural Replacement
– Life of Measure
• Review/Approval Process
– Involvement of stakeholders
– Importance of external “ peer” review
Cost-Effectiveness – Why Do We Care?
• Providing Policy Makers With Least Cost Options
– Political Support
– Community Support
– Stakeholder Support
• Identify Acceptable WUE Program
– Evaluate all WUE measures
– Select most cost-effective bundle
– Timing of future WUE investments
• Select Most Cost-Effective Approaches
– For achieving regulatory or policy objectives (e.g. implementing BMPs)
– For implementing measures favored by electeds and/or stakeholders
• Keeping Rates Affordable
Cost-Effectiveness Process

Cost-Effectiveness Key Factors
• Cost-effective ranking of possible WUE measures
– B/C ratio > 1 considered (benchmark)
– Compare available measures in meeting savings goal
• Rank of WUE Program vs. Other Resource Options
– Program B/C ratio vs. Other Options
– B/C ratio > 1 measures included in Program analysis
• Exceptions To The Rule: done the low-hanging fruit ones
– Few measures with B/C ratio > 1
– B/C ratio > 1 measures will not meet savings goal
2013 Draft California Water Plan Comparison of Water Management Options for San Diego
- Imported water $875-%975
- Surface water $400-$800
- Groundwater $375-$1,100
- Desalinated water $1,800-$2,800
- Recycled water $1,200 - $2,600
- Conservation $150-$1,000
October 2008 – CA Legislatures Office

Cost Effectiveness - Time

Program Cost-Effectiveness
• Important Element in Program Design
– How various measures compare
• Part of Measure Selection/Prioritization Process
– Select most cost-effective Program
• Acceptance by Stakeholders/Policy makers
– Review options
– Accept basis for Program selection/approvals
• Common Industry Practice
– Integrated planning element
– Urban Water Management Plans
– Local assessment for ratepayer
IRP: Water Option Evaluation (NPV)

Cost-Effectiveness - WUE
• Evaluate all possible measures in WUE Program
– How various measures compare
• Evaluating how WUE compares with other resource option
– Select most cost-effective Program
• Gathering Data For the Analsysis
– Updated benefit information
– Updated cost information
– Factor in option timing
Water Use Efficiency – Sample Costs

Fixture/Appliance Useful Life

Cost-Effectiveness and what is savings decay
He does not worry about it. It is a small factor. We have racheted down the savings so much I doon’t worry about it:
– Water savings decay is the reversal of the water use reductions achieved through implementing a conservation measure. Water savings decay occurs in two ways: (1) as a result of an end user’s behavioral change and (2) as a result of a fixture’s loss of water use efficiency.
– Consider when forecasting water demands
Notes On Useful Life/Savings Decay
– Toilet Efficiency Pre-1982=5.0 gpf
– Toilet Efficiency 1982-3.5 gpf
– Toilet Efficiency 1992-1.6 gpf
– Toilet Efficiency 2011-1.28 gpf
Cost effectiveness B/C ration
want it to be greater than 1 but if grant funding available may have less than 1

Benefit/Cost Evaluation-Analysis
• Cost-effectiveness is relied on most often to compare and evaluate water conservation measures that may be included in a Plan.
– Establishes who benefits/pays for conservation
– Can separately evaluate for customer and utility
– Assess ability to defer, downsize, or eliminate future water system improvements
What does Benefits Analysis Methodology look like in chart form?

What does Benefits Analysis Methodology look like in 2nd chart form?

Benefit/Cost Evaluation
• Common Utility screening tool for WUE
evaluation process
• Benefits/Costs = benefit cost ratio
• B/C ratio =/> 1.0 is considered feasible
• Compute present worth of time stream of
benefits and costs
• Can add qualitative benefits as percentage
bonus (e.g. environmental, socioeconomic)
Typical Benefits and Costs
• Reduced water purchase costs
• Reduced O&M costs (energy, chemical)
• Reduced/deferred treatment plant capital costs
• Reduced water storage costs
• Reduced wastewater processing costs
• Other capital cost savings (downsizing)
• Cost of WUE programs
– Implementation costs
– Reduced revenue cost impacts to utilities
– Customer costs
• Qualitative
– Environmental
– Socioeconomic
– Other
Cost Effectiveness: Internal Costs
Capital Costs + O&M Costs = Internal Costs
Internal Costs: Capital Costs
- Capital costs are all expenditures necessary to create a productive asset
- Many capital costs are financed by the Utility
- Tends to be projects over $1 million
- Capital costs can increase over time for a given project due to regulatory, environmental, cost of capital, or other forces that increase capital costs.
- Normally associated with Utility CIP Plan
- Typical projects: treatment, pipelines, storage, meters, larger repair/replacement
Internal Costs: O&M Costs
- On-going Utility costs associated with operating a productive asset
- O&M costs tend to be continuous throughout the Project’s useful life
- Utilities may employ internal or consultant support to perform necessary O&M functions
- Some O&M costs are subject to pricing increases such labor, energy and chemicals
- Typical projects: rehab, replacement, upgrade, and preventative or other maintenance activities
External Costs: Imposed Costs
- A production facility or process that has the potential to impose costs on third parties (such as Air Quality impacts from a Chemical Factory)
- A farmer who causes pesticides to runoff into a river that is used for drinking water. The Utility would incur additional costs to remove the pesticides from the drinking water before delivery.
- Any imposed costs should be calculated and considered in the cost-effectiveness analysis of any project.
External Costs: Environmental Costs
- Valuation of the loss of habitat or endangered species
- Screen projects for environmental effects
- May include mitigation or special monitoring costs associated with a given action or project
Internal benefits
• The value of increased production, energy generation, sales, additional service, or service
reliability
• Many capital costs are financed by the Utility
• Tends to be projects over $1 million
• Capital costs can increase over time for a given project due to regulatory, environmental, cost
of capital, or other forces that increase capital costs.
• Normally associated with Utility CIP Plan
• Typical projects: treatment, pipelines, storage,
meters
Internal Benefits of Water Resource Projects
- Indirect benefits from a project may be generated through avoiding certain costs the Utility is incurring. A good example is a Utility who develops a new surface water supply that replaces a groundwater supply that is seriously over drafted and causing salt water intrusion
- Avoided costs can be realized through avoidance of capital and/or O&M expenditures
- Example: Adding a 500 acre-foot surface water supply can avoid the need to build a desalination facility costing $5M. Both the capital and O&M costs would be avoided in the calculation.
- These costs should be adjusted to reflect the time value of money
Ex. AMI metering:
External Benefits
• Example: creating or increasing the capacity of a lake for water supply purposes may also provide recreation, habitat for fish and wildlife, or flood control benefits
• External benefits should be included in the calculation of total project benefits when evaluating the cost-effectiveness of various water resource options
External Benefits: Calculations
- Increased habitat = acres
- Protected farmland = acres
- Flood control = peak event/premium reduction
- Fish = source enhancements and creation of new habitat areas or protections that increase fish populations
- Recreation = increased rafting, boating, other recreational uses
- Lower water use = improved water quality for fish populations
Estimating Water Savings
• Art and Science involved
• More data available, the better…
• One approach: E = R x C x V
E = estimated annual reductions in water use from
measure
R = estimated reduction in water use from measure for all customers
C = % coverage of measure for the group of water users targeted
V = volume of water use w/out water efficiency measure
Estimating Benefits/Costs Sample
- Cost Savings From Reduced Purchase of Water
AWC = UPW x UCPW
AWC = annual water cost
UPW = units purchased annually
UCPW = unit cost of purchased water
Estimating Benefits/Costs - Sample
- Cost Savings From Reduced O&M Expenses -
Energy
VUCE = [AEC – (12 x MFEC) – (ECNP)] / UWU
VUCE = variable unit cost of energy
AEC = annual energy bill
MFEC = monthly fixed charges for energy
ECNP = energy costs not related to water production
UWU = annual units of water used
Estimating Benefits/Costs Sample
Cost Savings From Reduced O&M Expenses -
Chemicals
VUCC = [ACC – CCNP] / UWU
VUCC = variable unit cost of chemicals
ACC = annual chemical bill
CCNP = chemical costs not related to production
UWU = annual units of water used
Sample: B/C Calculatio

Discount Rate (Rate)
• Influential on PV/NPV calculations
• Should reflect either
– Best alternative use of available funds or
– Cost of capital (rate on long term debt)
• Rate
– High: future values diminish more quickly
– Low: future values diminish less quickly and have greater influence in present value
calculation
• Other Perspectives
– Utility (based on long term tax exempt bonds)
– Society (based on Treasury bonds)
– Ratepayer (based on rate of return for investments)
Sample B/C Analysis - Santa Barbara County Prop. 84
Untreated Water Landscape Irrigation Project

Cost-Effectiveness: Trends

Timing of Rate Adjustments Varies Widely

CA-NV Section AWWA Water Rate Surveys
- Recent Surveys: increasing rates
- California and Nevada water utilities
- Rates & connection charges
- 15 ccf/month assumed
- Billing Information
2017 CA-NV Section Water Rate Survey
Water agencies and utilities need to charge customers for water service through water rates based on the short and long-term costs of operating and maintaining water service to all current and future water customers. The revenue collected must be adequate to cover the costs of water resiliency and changing hydrologic conditions. Rate equity and rates that are easy to understand and implement are major considerations.
Proposition 218 Rate Setting Process

2017 CA-NV Section Water Rate Survey 2015 and 2017 Billing Frequency.

2017 CA-NV Section Water Rate Survey service charge and commodity charge breakdown in percentage.

2017 CA-NV Section Water Rate Survey - what was change in number of rates in “Budget, Tiered, Uniform, & Other”

2017 CA-NV Section Water Rate Survey

2017 CA-NV Section Water Rate Survey

2017 CA-NV Section Water Rate Survey

Rate Making 101

Rate Making 101
Revenue Requirements
Operation and Maintenance Costs Capital Improvement Costs Capacity Costs
Customer Costs
Administrative Costs
Cost of Service
Allocate costs amongst different types of users
Rate Design
Reflects cost of service
Horizontal Equity: similar costs = similar rates Vertical Equity: dissimilar costs = dissimilar rates
Rate Making 101
🞎 Revenue Requirements
🞑Operation and Maintenance Costs
🞑Capital Improvement Costs
🞑Capacity Costs
🞑Customer Costs
🞑Administrative Costs
🞎 Cost of Service
🞑Allocate costs amongst different types of users
🞎 Rate Design
🞑Reflects cost of service
🞑Horizontal Equity: similar costs = similar rates
🞑Vertical Equity: dissimilar costs = dissimilar rates
Rate Making 101
Financing
Existing Debt Service (sources/terms)
Future Utility Funding/Financing Needs Financing Plan For Five Year CIP Program Evaluation of best funding/financing package
Paying for WUE
Pursue both capital and operational sources
Outside Funding Opportunities
Regional cost sharing for WUE Program priorities State Proposition Funds/Other grants
Combine with capital financing
ialRate Design - Structures
– 3 to 5 tiers
– With a base/meter fixed charge
Upcoming: Water Budgets
– Most common in Southern California
Commercial
Fewer tiers perferred
Small and Large or Commercial and Industrial
Common User Classes
SFR, MFR, Com, Irr, Agency Facilit
Most Common: Tiered Rates (Inclining Block)
Increasing Block Rate - Example

Increasing Block Rate – City of Davis : single tier

Increasing Block Rate – City of Santa Barbara

Increasing Block Rate - LVVWD

How does City of Napa charge rates?
$4.04/1,000 gallons for all use
then they went to
- Revenue fluctuates directly with demand
- Rate stabilization fund important
- Easy to explain to customers
- Customer equity not as refined vs. tiers
- Not common today…
Increasing Block Rate - City of Napa Water Rates

Other Rates
• City of Davis Sewer Rate: base + consumption charges
• Consumption based on average water use Nov. – Feb.
• Consumption based sewer rates can have
positive/reinforcing impact on water use practices and behaviors
• Slowly gaining in popularity
• Not common today…
• Can be controversial…
• “Not all water consumed ends up in the sewer”
…and still more Rates/Charges/Fees
- Wholesale water rates/charges
- Wheeling charges (using someone else’s system)
- Outside service area charge (e.g. City of Napa)
- Water Connection Fees (new service)
- Typically for system capacity improvements
% Revenue: Fixed/Variable Charges
Fixed Charges – a portion of the bill remains the same (fixed), regardless of the amount of water used
Service Charge, Meter Charge, Minimum Charge
Variable Charge – “consumption charge” –rates applies to the amount of water used
Water units, Energy, Zones, Pumping
Water rate BMP looks to have more than 60% of water system revenue collected from the variable
charge components of a rate structure.
• The higher the % of revenue collected from the variable charges of a rate structure, the more
responsive demand would be to rate
changes.
Consider Weather in the Rate Setting Process
- Water Use/Rate tiers are influenced by weather
- Weather will effect irrigation accounts
- (use fluctuations, summer vs. winter)- “sticker shock”
- Weather could be causing a large peaking factor
- Regional historic records - Rainfall and ET patterns
- Helpful to understand weather influences
- Water conservation staff need to understand local weather and water use patterns
- Keep track – are weather patterns changing?
MWELO Water Budget %
55% ETO
Typical Monthly Evapotranspiration Rates
in California – Varies Locally

City of Davis Example
89% meters/connections are SFR
Very few large meters and accounts
- Lots of open space/irrigation
- Central Valley climate
- July water production 2.5x winter production
Conservation-Oriented Water Rates
- Block Rates (tiered rate concept)
- Budget Based (water allocation based)
- Drought Rates (short term to reflect shortage)
- Monthly vs. bi-monthly meter reading practices
- soften the “sticker shock”
- Don’t forget regulatory forces: PUC
Price Elasticity of Demand
- An academic indicator…
- Price Elasticity of Demand is defined as the measure of responsiveness in the quantity demand of a commodity as a result of change in price of the same commodity. It is a measure of how consumers react to a change in price
- Indoor use is more inelastic than outdoor use (less immediate conservation potential for indoor use)
- DWR 1998 study: 10% increase in price would reduce aggregate water demand by 1.6% (example)
- Factors include current price and demand and income
- Rate structure and climate can also influence this factor
Water Budget Approach
- Irvine Ranch Water District: 5-tier rate structure
- Allocation based (% of allocation) - # people + landscaped area (4 persons, 1300 sqft)
- [condo 425sqft]
- Per unit charge increases substantially with use
- Concept: reward efficiency, penalize high use
- Higher tier charges pay for conservation efforts
- Very intensive set-up/higher on-going admin. costs
- Not very common today…
Drought Rates (Surcharges)
- Short term during water shortage period
- Per unit charge increase with shortage severity
- Tier ranges can be adjusted when drought rates in effect
- Rate stabilization fund important – use during droughts
- Higher conservation levels can result in lower revenue
- Not popular, additional customer outreach required
Rate Impacts on Water Use
- City of Davis (1990): 230 gpcd (unmetered, flat rates)
- City of Davis (2010): 167 gpcd (metered, 2-tier rates)
- LVVWD: 2004 SFR Indoor Use = 65 gpcd
- LVVWD: Efficient Indoor Use = 39 gpcd
- Largest impact: metering, charging for water use
- Additional program savings more incremental
- Identify type of savings: annual, average, peak, other
- Other examples?
Understand Rate/Use Connection
- Know where your rates have been, where they are going…
- Rate policy can be helpful in designing, implementing and monitoring your water conservation programs
- Know where you stand on the water savings curve: already have high saturation levels?, or a new program?…
- Identify customer water use sensitivity to rate changes
- Rates can be a big factor in meeting organization conservation program goals and long-term use targets
Rate Making and Adoption Processes
- Each organization has their own preferences
- Rates must be legally defensible
- Conservation is one of many factors determining rates
- Conservation staff should be involved in the rate making process
- Rates impact conservation; conservation impacts rates
- Customer notification required – Prop. 218 notice
- Board/Council adoption required, private - (PUC)
- Timing of increases varies: usually in July or Jan.
- Many water bills include other charges as well
- Ex. City of La Verne - “Paramedic” fee
Sample Rate Setting/Adoption Schedule
- Prepare Rate Study – with recommended rates 4-6 months
- Finalize Recommended Rates – up to 5 Years 1-2 months
- Prepare/Distribute Prop. 218 notice to customers 2-3 months
- Board/Council adoption process, public comment 1-2 months
- New rates effective in July or when legally allowed 1-2 months
- Fall – Customer sees new rates on utility bill
- Other special meetings/public outreach
- Single or multi-year rate adjustment process
- Normal focus on rate impact (e.g. $/month increase)
Typical Timeline (6 month minimum) 9-15 months
Changing Rate Structure?
Requires planning, customer outreach
Same (or more) sensitivity than rate changes Typically part of initial water meter installation
Uniform Rate to Increasing Block Rate
“before” and “after” on bill before it takes effect
implement during low use period (cool weather)
Public outreach is critical
Accurate demand forecasting will reduce potential legal challenges…
Sample Utility Bill – Is Your Utility Bill Effective?

Water Rates: Important Part of Water Conservation Program
- Charging full cost of service
- Rate structures that increase charges with consumption tend to encourage water conservation behavior
- Water budget approach: growing type of rate policy
- AMI and rates together can help provide “cost controls” to customers
- Water rates fund water conservation programs
- Know your rates, the history and future direction…
AMI Metering System – Emerging Technology
- Provides customer hourly meter reading data
- Early leak detection benefit
- Meter tampering alarms
- More consumption data available to customer
- Customer access to AMI meter data important
- Some meter vendors offer cloud-based access
- Per Account meter reads per year
Monthly Meter Reading = 12
AMI hourly meter reading = 8,760
AMI Metering System – Total Process

Drought Planning and Management
Purpose: to prepare utilities to respond to drought conditions and to plan to minimize future drought impacts
M60 - Drought Definition
A deficiency of precipitation (snowfall) over an extended period of time, resulting in a water shortage for some activity, group, or environmental purpose. A water shortage occurs when supply is reduced to a level that cannot support existing demands. Natural forces, system component failure or interruption, or regulatory actions may cause these shortages. Such conditions could last a few months or extend over many years.
Drought Planning and Management Information Sources
- M60: AWWA Drought Preparedness and Response Manual
- 2020 DWR UWMP Guidebook
- Other Sources
DWR 2020 UWMP Guidebook Water Shortage Contingency Plan

DWR 2020 UWMP Guidebook Water Shortage Contingency Plan Table

Drought Planning - Checklist
- Utility Team
- Water Supply
- Water Quality
- Water Demands
- Water Shortage Contingency Plan
- Community Involvement
- Supplier Capabilities and Resources
Drought Planning Understand your shortage risk
- Document normal, dry and critically dry year water supply conditions and service reliability
- Update view of water demand patterns, trends and future water demand forecasts to overlay on water supply reliability work
- Determine role of WUE in dealing with short term drought conditions and preventing or mitigating future drought impacts on the Utility
DWR Reservoir Conditions – August 2021

Drought History - CA
1918-20 1923-26 1928-35 1947-50 1959-62 1976-77 1987-92 2006-2010 2011-2017 2020-2022
External Benefits
- Example: creating or increasing the capacity of a lake for water supply purposes may also provide recreation, habitat for fish and wildlife, or flood control benefits
- External benefits should be included in the calculation of total project benefits when evaluating the cost-effectiveness of various water resource options
Drought Conditions - CA

Drought Conditions - CA

2013 Rainfall Deficits - CA
• Precipitation deficits (vs. average) were severe:
– Occidental, Calif.: -41.54”
– Big Sur, Calif.: -37.62”
– Crescent City, Calif.: -35.11“
– Ukiah, Calif.: -29.85”
– Eugene, Calif.: -24.91”
• Other Examples:
– Paso Robles, Calif. (1.92”…yearly avg. = 12.78”)
– King City, Calif. (1.98”…yearly avg. = 12.06”)
– Hanford, Calif. (1.99”…yearly avg. = 10.10”)
– Los Angeles, Calif. (3.6” ….yearly avg. = 11”)
– Sacramento, Calif. (6.5” ….yearly avg. = 19”)
2013 Dry Year – Sacramento, CA
The August 2021 24-Month Study projects the January 1, 2022 Lake Mead
elevation to be at or below 1,075 feet and at or above 1,050 feet. Consistent with Section 2.D.1 of
the Interim Guidelines, a Shortage Condition consistent with Section 2.D.1.a will govern the
operation of Lake Mead for calendar year 2022.
In addition, Section III.B of Exhibit 1 to the Lower Basin Drought Contingency Plan (DCP) Agreement
will also govern the operation of Lake Mead for calendar year 2022.
USBR Declares Phase 1 Drought Condition and Operational Changes For Bureau Contractors
(August 2021)
Las Vegas Region Water Supply at risk, note that USBR did not declare drought
conditions during 2012-2016 drought cycle…
Lake Shasta Reservoir – 36% Jan. 2014

Lake Shasta Reservoir Storage Data

Folsom Lake Storage Data – Jan. 2014

Lake Mead – NV (On-going drought)

Lake Mead – NV (On-going drought)
The August 2021 24-Month Study projects the January 1, 2022 Lake Mead
elevation to be at or below 1,075 feet and at or above 1,050 feet. Consistent with Section 2.D.1 of
the Interim Guidelines, a Shortage Condition consistent with Section 2.D.1.a will govern the
operation of Lake Mead for calendar year 2022.
In addition, Section III.B of Exhibit 1 to the Lower Basin Drought Contingency Plan (DCP) Agreement
will also govern the operation of Lake Mead for calendar year 2022.
USBR Declares Phase 1 Drought Condition and Operational Changes For Bureau Contractors
(August 2021)
Las Vegas Region Water Supply at risk, note that USBR did not declare drought
conditions during 2012-2016 drought cycle…
Lake Mead – NV (On-going drought)

Drought Plan Response
Ever Changing Conditions - 2021
• CA: State Water and Central Valley Projects

Annual Rainfall Patterns: 1872-2004

Sample Water Supply Reliability Curve

Sample Water Supply Reliability Risk
• Agency 1: 100% groundwater (one source)
• Agency 2: 100% surface water (one source)
• Agency 3: Diversified portfolio
Diversified water portfolios are required for long term water resource
sustainability and resiliency for most water agencies in CA and NV.
Sample Water Supply Reliability Risk

Understand Drought Shortage Triggers
• 100% Groundwater
– Declining groundwater levels due to extended dry conditions, stages triggered by declining water level thresholds.
– City of Davis - 2000 UWMP
• Stage I: -110 foot static water levels
• Stage II: -120 foot static water levels
• Stage III: -130 foot static water levels
• Stage IV: -140 foot static water levels
Understand Drought Shortage Triggers
• More than 27 million Californians receive at
least part of their water from surface water supplies (including the CVP/SWP).
• During drier years, SWP deliveries of less than
approximately 1,721 TAF would occur about 20% of the time (50% of current avg. deliveries)
SWP Drought Deliveries

SWP Delivery Reliability

Understand Drought Shortage Triggers
• 100% Surface Water
– Subject to dry year water allocation reductions
– City of Yuba City: SWP Feather River source
• Stage I: Tied to dry year SWP allocation reductions
• Stage II: Tied to dry year SWP allocation reductions
• Stage III: Tied to dry year SWP allocation reductions
• Stage IV: Tied to dry year SWP allocation reductions
Understand Drought Shortage Triggers

SWP - state water project
CVP - central valley project
SCVWD Water Use Trends

SCVWD Future Demand Forecast

Drought Planning Triggers
• Types of Drought Plan Criteria

Drought Planning Approach
• Approach For Achieving Drought Shortages

Drought Planning Approach
• Potential Savings/Impacts

Drought Planning Approach
* Demand Reduction and Supply Augmentation

CIP - Conservation Improvement Projects
Drought Plan Response Low Hanging Fruit
• Expand toilet/clothes washer rebate programs
– Water efficient homes use 24 gpcd less indoor use
• Leak detection and repair
– Customer (data driven – AMI)
– Utility (more detection, faster repair)
• Water audits – customer assistance
• Landscaping
– Consider turf removal/low volume irrigation incentives during the drought period
Drought Plan Response
3 Methods of Demand Reduction
• Restrictions on water use practices
– Watering days/times
– Hosing hard surfaces
– No irrigation runoff
• Price restructuring – use and revenue drivers
– Higher pricing during drought periods
– Target uses/timing of reductions through pricing
• Rationing – setting limits on customer usage
– Gallons/account limits on customer use (0-4 ccf)
Drought Plan Response Rationing Allocations
• % Reduction Allotments – all accounts
– Useful for nonresidential vary based on efficiency
– Easy to determine and administer
– Establish min./max. amounts to limit extremes
– Penalizes conservers
– Rewards above average users
– Promotes water use during non-shortage periods
Drought Plan Response Rationing Allocations
% Reduction Allotments – all accounts
– Useful for nonresidential vary based on efficiency
– Easy to determine and administer
– Establish min./max. amounts to limit extremes
– Penalizes conservers
– Rewards above average users
– Promotes water use during non-shortage periods
Per Connection – all accounts
– Easy to establish allotments
– No relationships between customer characteristics and water use
– Not equitable
– Does not recognize historical use
• Per Capita Allotment: residential
– Suitable for extreme shortages
– Equitable base allotment, sewer charges # residents
• Must determine/update per account occupancy
• Water for essential inside use only
• Does not recognize historical use
– Fixed amount of water per person, can be staff intensive
Hybrid Per Capita/Percentage: residential
– Equitable recognizes various uses
– Flexibility suitable to all stages
– Provides customers greatest control
– Recognizes factors like lot size, historic use, and
economics
• Additional staff/computer work to determine allotments
• Requires more public education
Drought Management - Enforcement
• Enforcement Options
– Citations
– Fines
– Special ordinances/policies in place
– Additional staff required
• Usually part of mandatory stage actions
Drought Management
- Not all user classes can save the same amount of water
- Especially important in later stages of drought response effort
Monitoring – GPCD By Sector

Variation In Staged Reduction Savings

Drought Management - Communications
Clear messaging and feedback to customers

Drought Management - Communications
- Newsletters
- Newspaper
- Utility Bill Stuffers
- Utility Bill Messages
- Direct mail
- Internet
- Social Media
- Speakers Bureau
- Workshops/Events
- Drought Team Meetings/outreach
- Starts-Ends with meeting water use target
Drought Management
• Usual sequence of events
– Jan/Feb: awareness of impending drought
– Mar/Apr: rollout initial stage and response info.
– Apr/May: begin stage responses
– May: verify shortage magnitude/targets
• Every drought cycle is different
• Each Utility affected differently
Drought Management
• Not all user classes can save the same amount of water – especially true in later stages
• Allow time for rate adjustments if part of the drought response plan
– Have drought rates in advance; or
– Develop new drought rates to fit current shortage
– Stakeholder involvement could affect schedule
• Normally drought stages will unfold over years
Drought Management - Wastewater
- Inform wastewater agencies of water supplier plans to reduce indoor demands
- Assess any potential impacts in the event of severe water demand cutbacks
Monitoring – Wastewater Flows

Sample Drought Surcharges

Implementing Drought Plans Requires Adequate Resources

Provided to those taking the AWWA CA-NV Section WUE Exams…

Math Building Blocks – Fractions

Math Building Blocks – Fractions

Unit Conversion – Ex. [IMPORTANT]

Unit Conversion – Ex. [IMPORTANT]

Water Distribution Exam Math Cheat Sheet – Unit Conversion

Unit Conversion – Using Your Cheat Sheet

Question – Unit Conversion
- Convert 113 miles to feet

Question – Unit Conversion

Question – use your cheat sheet…
4 ft3/sec.

Question – use your cheat sheet
answer 4 ft3/sec

Question – use your cheat sheet
Answer 3.3 ft3

Question – use your cheat sheet
Answer 3.3 ft3

Question – use your cheat sheet
Answer 1,953 gallons

Question – use your cheat sheet…
answer 1,953
gals.

How does CA need to adapt to increasing drought intensity?
California needs to adapt to increasing drought intensity. Agriculture relies heavily on groundwater during droughts to maintain this key drought reserve. An increase in tree and vine crops—which need to be watered every year—is making farming more vulnerable to water shortages. State law now requires water users to bring their groundwater basins into long-term balance by the early 2040s. This will likely require farm water use to fall in regions that have been over-pumping, including the southern Central Valley and the Central Coast. In urban areas, the greatest potential for further water savings lies in long-term reductions in landscape irrigation—a shift requiring changes in plantings and watering habits. Finally, state and federal regulators will need new approaches to reduce
harm to fish and wildlife during increasingly intense droughts. This will require better drought planning, investments in new habitat, and setting aside water during wet years for ecosystem uses in dry years.
CA law for GPCD
55 GPCD IN Jan 2025 and
50 GPCD in 2030
CA law for GPCD
55 GPCD IN Jan 2025 and
50 GPCD in 2030
