Unit 01: Basic Economic Concepts Flashcards
01.02 Economic Basics
What is a Market Economy?
Questions are answered by the forces of supply and demand
- individuals own factors of productoin
- freedom to buy and sell
ex: USA
01.02 Economic Basics
What is a Command Economy?
Government makes decisions and own all factors of production
- no incentives take risks
- ex: Cuba, USSR
01.02 Economic Basics
What is the Traditional Economy?
Economic decisions dicated by traditions
- market forces not a factor
- third world nations
01.02 Economic Basics
What is a mixed economy?
Two or more types economies exist in one nation
01.02 Economic Basics
What is postitive and normative economics?
Positive Economics: way to look at economy → “what goods are produced”
Normative Economics: how things should be
01.02 Economic Basics
What are the factors of Production?
Hard answer questions → unlimited wants & scarce resources
Economics: study allocation scarce resources

01.03 Scarcity and Opportunity cost
What is scarcity and opportunity cost?
Economics → study overcome scarcity
- economic goods (hold value) are scarce (limited)
Scarcity → force make decisions and trade-offs = opportunity cost
“cost of choice make”
thing give up = opportunity cost (next best alternative)
- 3 options: second best → opportunity cost
01.04 Production Possibilities Curves
What is th Law of Increasing Opportunity cost?
Increase production of one goods, must give up increasing units of other
01.04 Production Possibilities Curves
Define Resource Sustainability
Resources in economy not adaptable to produce both goods
01.04 Production Possibilities Curves
What are the three types of curves of a PPC Curve?
Concave (bowing): indicates opportunity costs between two goods
- due to Law of Increasing Costs
Diagnonal Line: constant opportunity costs
Straight Line: no opportunity cost
- good parallel to line = free
01.04 Production Possibilities Curves
According to the production possibilities curve above, if the economy moves from point B to point E, the opportunity cost of each additional guava jelly
- increases.
- decreases.
- remains the same.

Increase
01.04 Production Possibilities Curves
According to the production possibilities curve above, which letter best represents an economy whose resources are not being fully utilized?
- A
- B
- C
- D
- E

4. D
01.04 Production Possibilities Curves
According to the production possibilities curve above, what is the opportunity cost of adding an additional 75 fishing boats in an economy that is already producing 75 fishing boats?
50 fishing boats
100 fishing boats
50 jars of guava jelly
100 jars of guava jelly
200 jars of guava jelly

1. 200 jars of guava jelly
01.04 Production Possibilities Curves
- If the production possibilities curve is concave from the origin, then economists say that
resources are scarce in the economy.
economic growth is occurring in the economy.
resources are not equally suited for the production of both goods.
resources are being inefficiently used in the economy.
resources are equally suited for the production of either good.
3. resources are not equally suited for the production of both goods.
01.04 Production Possibilities Curves
According to the production possibilities frontier above, a movement from the inside curve to the outside curve represents
- inefficiency in the economy.
- an unattainable point in the economy.
- economic growth in the economy.
- a decrease in resources
- a change from unemployment to full employment of resources in the economy.

3. economic growth in the economy.
01.04 Production Possibilities Curves
- If the production possibilities curve is a vertical line, then economists say that
- there are constant opportunity costs associated with these goods.
- resources are equally suited for the production of either good.
- the good on the X axis is a free good.
- the good on the Y axis is a free good.
- there are increasing opportunity costs for producing both goods.
4. the good on the Y axis is a free good.
01.04 Production Possibilities Curves
If an economy is operating at a point on the production possibilities curve, economists say that it is operating
below the full employment level of output.
above the full employment level of output.
at a level that is inefficient given the resources available.
at the full employment level of output.
at a level that is attainable but inefficient.
4. at the full employment level of output.
01.04 Production Possibilities Curves
Correct
All of the following will cause an outward shift of the production possibilities curve except:
New technology
Increased education of workers
An increase in productive resources
A decrease in population
Software advances
4.
A decrease in population
An example of an economic inefficiency in a nation is
- full employment.
- unemployment.
- opportunity cost.
- production possibilities.
- resources.
2. unemployment
01.05 Absolute and Comparative Advantage
Define Absolute and comparative advantage?
Absolute Advantage
Better at both tasks; who produces the most goods the fastest
Comparative Advantage
Lowest opportunity cost to produce something
01.05 Absolute and Comparative Advantage
What are the steps to determine comparative advantage?
Step 01: Divide the number of each product by number of product I for company A
Step 02: Divide the number of each product by number of product I for company B
Step 03: Divide the number of each product by number of product II for company A
Step 04: Divide the number of each product by number of product II for company B
Step 05: Determine which has to lowest opportunity cost for each product
01.06 Demand
Define Demand:
Demand: when an entity is both (1)willing and (2)able to purchase an item.
01.06 Demand
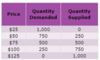
What is Quantity Demaded?
Law of Demand:
Inverse relationship between price and quantity demanded (QD)
Influencing Factor: PRICE
- Determine if consumers buy more or less
What: Quantity demanded
- only moved point on curve (not curve as a whole)
- Inverse relationship with price
01.06 Demand
What are the Determinants of Demand? (5)
- shifts entire demand curve*
1. Tastes and Preferences
what: any number things change → make consumers buy more
example: celebrity endorsement, accusation racism, health concerns
2. Related goods and services
what:
- Less willing buy if substitutes are cheaper
- Pay more if any complements are cheaper
example: salsa demand increase, so does chips
3. Income
what:
- Normal goods: direct relationship increase in income and demand
- Inferior goods: inverse relationship between increase in income and demand
- Buyers (amount of)
what: more people demand goods → curve shift right (opposite if people decrease) - Expectations of price
what:
- believe price about to go up → shift right
- believe price go down soon → shift left
01.06 Demand
What are the reasons for downwards sloping demand curve?
- Willing and able as price decreases
- Income Effect:
buy more if the price decreases
- Substitute Effect:
substitute the less expensive good
01.06 Demand
What are complements and subsitutes?
Complements: demand dependent upon change in price other good (inverse relationship)
Substitutes: the price of one increases the demand for substitute good increases (direct relationship)
01.06 Demand
What are normal and inferior goods?
Complements: demand dependent upon change in price other good (inverse relationship)
Substitutes: the price of one increases the demand for substitute good increases (direct relationship)
01.05 Absolute and Comparative Advantage
Assume the Macro Islands can produce 25 fishing boats or 150 jars of guava jelly in one hour. The Micro Islands can produce 30 fishing boats or 300 jars of guava jelly in the same time period. This data tells an economist that
- the Macro Islands have an absolute advantage in producing fishing boats and the Micro Islands have an absolute advantage in producing guava jelly.
- the Micro Islands have an absolute advantage in producing fishing boats and the Macro Islands have an absolute advantage in producing guava jelly.
- the Macro Islands have a comparative advantage in producing fishing boats and the Micro Islands have a comparative advantage in producing guava jelly.
- the Micro Islands have a comparative in producing fishing boats and the Macro Islands have a comparative advantage in producing guava jelly.
- the Micro Islands have a comparative and absolute advantage in producing fishing boats.
3. the Macro Islands have a comparative advantage in producing fishing boats and the Micro Islands have a comparative advantage in producing guava jelly.
01.05 Absolute and Comparative Advantage
2.
Assume the Macro Islands can produce 25 fishing boats or 150 jars of guava jelly in one hour. The Micro Islands can produce 30 fishing boats or 300 jars of guava jelly in the same time period. The opportunity cost of producing 1 fishing boat in the Micro Islands is
- 1/10 jar of guava jelly.
- 1/6 jar of guava jelly.
- 6 jars of guava jelly.
- 10 jars of guava jelly.
- indeterminate with the information given.
4. 10 jars of guava jelly.
01.05 Absolute and Comparative Advantage
The production possibilities frontiers above show the production possibilities for two goods produced in the Macro and Micro Islands using the same resources. From these curves, we can determine that
- the Micro Islands have an comparative advantage in producing suntan lotion and sun glasses.
- the Micro Islands have an absolute advantage in producing sun glasses and suntan lotion.
- the Macro Islands have a comparative advantage in producing suntan lotion.
- the Macro Islands have an comparative advantage in producing sun glasses.
- The Macro Islands have a comparative advantage in producing suntan lotion and the Micro Islands have a comparative advantage in producing sun glasses.

4. the Macro Islands have an comparative advantage in producing sun glasses.
01.05 Absolute and Comparative Advantage
Two nations are negotiating a trade agreement for two goods. Both nations have the same amount of resources available to produce the two goods. Using the production possibilities curves above, you can determine that the opportunity cost of one unit of good B is
- 4 units of good A for Nation X and 2 units of good A for Nation Y.
- 4 units of good A for Nation X and 1/2 unit of good A for Nation Y.
- 1/4 unit of good A for Nation X and 2 units of good A for Nation Y.
- 1/4 unit of good A for Nation X and 1/2 unit of good A for Nation Y.
- 200 units of good A for Nation X and 50 units of good A for Nation Y.

2. 4 units of good A for Nation X and 1/2 unit of good A for Nation Y.
01.05 Absolute and Comparative Advantage
Refer to the graph above of a country’s production possibilities curve. If three automobile tires are currently being produced, the opportunity cost of producing the fourth automobile tire would be
- 60 car radios.
- 50 car radios.
- 45 car radios.
- 35 car radios.
- 25 car radios.

4. 35 car radios.
01.05 Absolute and Comparative Advantage
Meagen and Jim both produce pies and loaves of bread for bakeries in the Macro Islands. The table above shows some of the combinations of the two products that can be produced using the same resources.
Use the table above to answer the following questions:
- What is Meagen’s opportunity cost for producing 1 pie and 1 loaf of bread?
- What is Jim’s opportunity cost for producing 1 pie and 1 loaf of bread?
- Who has the comparative advantage in the production of each good?

Part a:
Megan can produce 20 pies (and 0 bread) or 60 bread (and 0 pies). Therefore, the opportunity cost of pies is as follows:
- 20 pies ÷ 20 pies = 1 pie
- 60 bread ÷ 20 pies = 3 bread
However, the opportunity cost of the production of bread is as follows:
- 60 bread ÷ 60 bread = 1 bread
- 20 pies ÷ 60 bread = 1/3 pies
Part b:
Jim can produce 80 pies (and 0 bread) or 40 bread (and 0 pies). Therefore, the opportunity cost of pies is as follows:
- 80 pies ÷ 80 pies = 1 pie
- 40 bread ÷ 80 pies = 1/2 bread
However, the opportunity cost of producing bread is as follows:
- 40 bread ÷ 40 bread = 1 bread
- 80 pies ÷ 40 bread = 2 pies
Part c:
The opportunity cost for Megan to produce 1 pie is 3 bread, while Jim’s opportunity cost to produce a pie is equal to only 1/2 bread; therefore, Jim has the comparative advantage in the production of pies. However, where it takes Jim 2 pies to produce 1 bread, it only takes Megan 1/3 pie to produce a loaf of bread, meaning that Megan has the comparative advantage in bread production.
01.06 Demand
If the price of papayas increases from $1.00 each to $1.25, will this cause a change in demand or quantity demanded?
- Quantity Demanded
- Demand
- Demand is the entire curve.
1. Quantity Demanded
01.06 Demand
Use the table above showing three demand curves (D1, D2, and D3) to answer the following question.
Given the demand curve D2 for papayas and a price of $2.50, if more consumers move to the Macro Islands how many papayas are consumers now willing and able to purchase at $2.50?
- 200
- 150
- 100
- 250
- 300

1. 200
01.06 Demand
If more consumers move to the area, will this cause a change in demand or quantity demanded?
- Quantity Demanded
- Demand
2. Demand
01.06 Demand
- If a new technology made it easier to draw crude oil out of the ground, how would demand for crude oil change as a result?
- Decreases
- Increases
- Remains the same
3. Remains the same
01.06 Demand
When Mrs. Edwards raises the price of Grad Nite tickets,
- the demand for movie tickets increases because of the increase in the number of buyers.
- the quantity demanded for movie tickets increases because the price of Grad Nite tickets increases.
- the demand for movie tickets increases because student incomes change.
- the demand for movie tickets increases because they are cheaper than Grad Nite tickets.
- the quantity demanded for movie tickets increases because the number of buyers increases.
4. the demand for movie tickets increases because they are cheaper than Grad Nite tickets.
01.06 Demand
The demand for Grad Nite tickets would decrease if
- your income decreased and the price of tickets decreased.
- your income decreased and Grad Nite tickets were a normal good.
- your income decreased and Grad Nite tickets were an inferior good.
- the price of Grad Nite tickets increased.
- your income increased and Grad Nite tickets were a normal good.
2. your income decreased and Grad Nite tickets were a normal good.
01.06 Demand
Suppose people like tuna salad and chicken salad equally well. If the price of tuna salad increases, which of the following statements is true?
- The quantity demanded of chicken salad will decrease.
- The quantity demanded of tuna salad will decrease.
- The demand for tuna salad will increase.
- The demand for tuna salad will decrease.
- The demand for chicken salad will decrease.
2. The quantity demanded of tuna salad will decrease.
01.06 Demand
- If the demand for pineapple rises when people’s income rises, then pineapple is a(n)
- normal good.
- inferior good.
- substitute good.
- complementary good.
- preferred good.
1. normal good.
01.06 Demand
If demand for flash drives increases when the price of cell phones increases, we can say that cell phones and flash drives are
- normal goods.
- inferior goods.
- substitute goods.
- complementary goods.
- preferred goods.
3. substitute goods.
If the price of energy drinks increases, then the
- demand for energy drinks increases.
- quantity demanded for energy drinks increases.
- demand for energy drinks decreases.
- quantity demanded for energy drinks decreases.
- supply of energy drinks increases.
4. quantity demanded for energy drinks decreases.
01.07 Supply
Define Supply:
Suppliers are (1) willing and (2) able to produce goods and services
Price → main factor determines whether producer willing to sell
only change with quantiy suppied
Law of Supply: Direct relationship between price and quantity supplied
- if price for a commodity is low, firm will produce less
01.07 Supply
Define the Determinants of Supply: (6)
- Resources: cost and availability
what: resources necessary become more expensive → curve move left (opposite if resources more available) - Other good’s price
what:
- Left: suppliers easily switch prouction to another good for more probability
- Right: cannot make as much producing other good, supply curve move back
- Taxes, subsidies, and government regulations
what:
- subsidy effectively lower cost of production → right
- regulations or tax increase cost of production → left
- Technology (productivity)
what: new tech generally lowers resources costs (right) - Expectations of the producer
what: expect demand increase/decrease = adjust production - Number of the firms in industry
what: number firms in industry increase (ceteris paribus) = supply right
01.07 Supply
Use the table above showing three supply curves (S1, S2, and S3) to answer the following question.
Given the supply curve S2 for papayas above, if the price of papayas increases from $2.50 each to $3.00, how many papayas are producers willing and able to supply?
- 350
- 250
- 200
- 300
- 150

2. 250
01.07 Supply
If the price of papayas increases from $1.00 each to $1.25, will this cause a change in supply or quantity supplied?
- supply
- quantity supplied
2. quantity supplied
01.07 Supply
If a new lemon juicer is produced that is more efficient than human laborers, what will happen to supply of lemonade as a result?
- increases
- remains the same
- decreases
1. increases
01.07 Supply
- If the minimum wage that all businesses pay their employees increases, what happens to the supply of consumer goods as a result?
- increases
- remains the same
- decreases
3. decreases
01.07 Supply
When Mrs. Edwards lowers the price of Grad Nite tickets, the
- the supply of Grad Nite tickets increases because of the increase in the number of sellers.
- the supply for Grad Nite tickets increases because there are more resources.
- the supply for Grad Nite tickets increases because there is a decrease in regulations.
- the quantity supplied for Grad Nite tickets decreases because the price decreases.
- the quantity supplied for Grad Nite tickets increases because the price decreases.
4. the quantity supplied for Grad Nite tickets decreases because the price decreases.
01.07 Supply
The market for flip-flops is in equilibrium. If a new machine is created to mold the shoes, then we would expect to see a/an
- increase in supply.
- increase in quantity supplied.
- decrease in supply.
- decrease in quantity supplied.
- shortage in the market.
1. increase in supply.
01.07 Supply
The market for flip-flops is in equilibrium. If the price increases from $4.00 to $5.00, then we would expect to see a/an
- increase in supply.
- increase in quantity supplied.
- decrease in supply.
- decrease in quantity supplied.
- shortage in the market.
2. increase in quantity supplied.
01.07 Supply
The market for orchids is in equilibrium. If the price decreases from $10.00 to $5.00, then we would expect to see a/an
- increase in supply.
- increase in quantity supplied.
- decrease in supply.
- decrease in quantity supplied.
- surplus in the market.
4. decrease in quantity supplied.
01.07 Supply
The market for orchids is in equilibrium. If a freeze in the southeast causes the rose growers to begin growing orchids, then we would expect to see a/an
- increase in supply of orchids.
- increase in quantity supplied of orchids.
- decrease in supply of orchids.
- decrease in quantity supplied of orchids.
- surplus in the market of orchids.
1. increase in supply of orchids.
01.07 Supply
The market for orchids is in equilibrium. If the government decreases business taxes, then we would expect to see a/an
- increase in supply.
- increase in quantity supplied.
- decrease in supply.
- decrease in quantity supplied.
- shortage in the market.
1. increase in supply.
01.08 Equilibrium
Define Equilibrium:
Point where the demand and supply curve intercepts
- Price suppliers charge for their product & price consumers should pay for product
01.09 Price Ceilings and Floors
Define Price Floors:
Government sets lowest price a business allowed charge for a good
QS > QD
Result: SURPLUS
- more goods than people want to buy
- waste of goods
01.09 Price Ceilings and Floors
Define Price Ceilings;
Legal price maximum is placed on a good
QD > QS
Result: SHORTAGE
- less goods than people willing to bue
- result: discrimination, black markets, poor maintenance
01.09 Price Ceilings and Floors
Which of the following will occur if the government institutes an effective price floor on ice cream?
- There will be an increase in supply of ice cream.
- There will be an increase in demand for ice cream.
- There will be a decrease in demand for and an increase in supply of ice cream.
- The quantity demanded will be greater than the quantity supplied of ice cream.
- The quantity supplied will be greater than the quantity demanded for ice cream.
5. The quantity supplied will be greater than the quantity demanded for ice cream.
01.09 Price Ceilings and Floors
When the government sets an effective price floor
- there will be an increase in supply.
- there will be an increase in demand.
- there will be a decrease in supply.
- there will be a decrease in demand.
- neither supply nor demand will change.
5. neither supply nor demand will change.
01.09 Price Ceilings and Floors
When the government sets an effective price floor
- suppliers are helped and consumers are helped.
- suppliers are hurt and consumers are helped.
- suppliers are helped and consumers are hurt.
- This is an incorrect answer. Have a nice day!
- supply increases due to the increase in price.
3. suppliers are helped and consumers are hurt.
01.09 Price Ceilings and Floors
According to the table above, if the government sets an effective price floor of $100,
- market forces will cause the quantity demanded to drop and the quantity supplied to rise.
- a shortage will exist.
- a surplus will exist.
- market forces will cause demand to drop and supply to rise.
- market forces will cause supply to drop and demand to rise.

3. a surplus will exist.
According to the table above, if the government sets an effective price floor of $100,
- the supply will decrease to create equilibrium.
- the demand will decrease to create equilibrium.
- the quantity supplied will increase to create equilibrium.
- the quantity demanded will be 250.
- the market will be in equilibrium.

4. the quantity demanded will be 250.
What two factors causes the PPF to shift?
- Amount of resources in the economy
- Changes in technology or productivity
What is the Law of Increasing Costs?
More of a product is produced, the opportunity cost will increase
(illustrated in concave curves)