Regression; Lec 8; Lab 4 Flashcards
What is a coefficient?
A factor that makes up a particular property
What does a significant r mean?
That the regression coefficient is also significant
Which variable goes on X axis and which goes on Y axis?
Variable which ‘varies’ (IV) on the X-axis Variable measured (DV) on the y-axis
If you want to predict university score from SAT scores - which is predictor variable and which is criterion variable?
SAT score is predictor variable
University score is criterion variable
What is a negative correlation?
As one variable increases so the other decreases
What does it mean when variables are said to covary?
That they have either a positive or negative correlation to one another
What is the predictor variable?
Independent variable - used to predict an outcome (variable that varies)
What are three things that are important to remember in regression?
- Any set of data can have a regression line plotted
- The significance of the correlation or regression tells us whether a real relationship exists
- The correlation or the standard error of estimate tells us how accurate the regression equation is
How should
rxy = cov(x,y)/SxSy
Where
Covxy = Σ(X - Xbar)(Y - Ybar)/N-1
be interpreted?
- It is an indication of how closely the data points lie along the line of best fit (the regression line)
- Like all stats requires a p value to determine whether the relationship is due to chance or is the product of a real relationship
what is r2 =
The proportion of the variance in the DV that is predictable from the IV.
Regression produces eight different analyses:
- Descriptive statistics,
- correlations,
- variables entered/removed,
- Model summary,
- ANOVA,
- Coefficients,
- Casewise diagnostics,
- Residual Statistics
First we look at ‘casewise diagnostics’, which should we look at second? Why?
Model summary
This is related to the correlation
r is the Pearsonn correlation restated
r2 is the coefficient of determination (a measure of relative variability) and indicates how much of the variation in the DV can be explained by variation in the IV
‘Std. Error of the Estimate’ is the std. error of prediction for all the values - this gives up a direct measure of the potential of our predictions using the regression equation. You compare this score to the SD of the criterion variable to get an indication of how useful the regression is (if the score in the regression is lower than that of the criterion variable score than it is useful)
What is this the formula for?
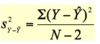
Note: in this instance the denominator = N-2 because we are imagining 2 values involved in the prediction
Residual/error variance
Regression produces eight different analyses:
- Descriptive statistics,
- correlations,
- variables entered/removed,
- Model summary,
- ANOVA,
- Coefficients,
- Casewise diagnostics,
- Residual Statistics
First we look at ‘casewise diagnostics’, then we look at ‘Model summary’, what should we look at third? Why?
Coefficients (factor that makes up a particular property)
- Column ‘B’, the value idenitified as constant is the intercept (a in regression equation)
- Slope/gradiant of the line = identified by name given to predictor variable (b in regression equation)
H0 rho =
0
where rho is the population correlation coefficient
r2 can give us % predictable variance. Using the smoking and CHD example, where r2 = .7232 = .508, explain.
r = .713
r2 = .7232 = .508
Approximately 50% in variability of incidence of CHD mortality is associated with variability in smoking - NOTE: you cannot infer a cause and effect relationship
This is the formula for the regression of the line.
How do you calculate b?
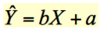
SX2 = variability of X

What is the standard error of prediction?
Standard dev. of all predicted values minus the recorded value.
How do we know if our prediction is better than just using the mean?
Total SS - residual SS
What is the criterion variable?
Dependent variable (variable measured)
What can badly affect Pearson’s r?
- Data with outliers
- Data that is not linear (e.g. curvilinear - a smooth curve of any shape)
Covxy = ?
Covxy = Σ(X - Xbar)(Y - Ybar)/N-1
There are two possible ways to predict - what are they?
- Basic = difference from mean scores (average Y)
- Total sums of square
- Regression = difference from the regression line (difference from Yhat)
If you want to predict the incidence of CHD in population based on incidence of smoking - which is the predictor variable? Which is the criterion variable?
- Predictor variable X (IV) = average number of cigarettes smoked per head of population
- Criterion variable Y (DV) = incidence of CHD
How do you remove a data point from analysis?
Data –> Select cases –> ‘Select Cases’ dialogue box –> ‘If condition is satisfied’ –> ‘If…’ –> move variable you want to exclude to box and then put ~ (tilda - should not equal) and then type value of outlier you want to remove (e.g. 12.45) –> continue –> OK
Then you must re-run the analysis you wanted to run.


