Population Flashcards
Population Ecology
Study of population dynamics, the growth and shrinking of populations in response to changes in abiotic and biotic factors (learning how and why populations grow)
Geometric Population Growth
Growth model for populations with non-overlapping generations and unlimited resources. Only one discrete reproduction event per unit of time for all individuals (individuals added to the population all at once). Successive generations differ in size by a constant ratio.
Finite rate of increase (λ)
The finite rate of increase for a population with non-overlapping generations growing geometically is the ratio of the population size at one time step ( Nt+1 ) to the size of the population at the previous time step ( Nt ). λ = Nt+1 / Nt Usually, the time step used is equivalent to the generation time (e.g., a year for an annual plant). The geometric growth model assumes the population’s growth is not restricted by limiting resources, predation, etc.
If the population grows at a fixed rate, λ will be _____
the same at any time t. The ratio of λ=Nt+1/Nt will be constant.
λ for a shrinking population
0 < λ < 1 (e.g. 0.5)
λ for a growing population
λ > 1
λ for a population with no growth
λ = 1
λ = 1
λ for a population with no growth
λ > 1
growing population
0 < λ < 1
shrinking population
How can you predict the future population size of a geometrically growing population?
Nt = Niλ^t
What are examples of populations that fit a geometric growth model?
Populations with a pulse of “births” (one particular reproduction period per year) where successive generations of a population do not overlap. Many plants, some fish, and ungulates like bison, elk, and wildebeast
Parthenogenesis
Parthenogenesis is known as “virgin birth” since it is the production of offspring without fertilization. Some organisms can reproduce both sexually and asexually. With sexual reproduction, males of the species fertilize the eggs of the females in the usual manner. When reproducing parthenogenetically, females have the ability to effectively clone themselves by developing unfertilized eggs. Parthenogenesis can be a means to rapidly increase population size and/or be a response to take advantage of favorable and stable environmental conditions. The phenomenon occurs most commonly in plants and invertebrates such as aphids, bees, and parasitic wasps. Parthenogenesis is more rarely observed in vertebrates such as lizards and fish.
Nymph
A nymph is an immature life stage of some insects that go through incomplete metamorphosis (known as hemimetabolism). A nymph’s appearance and body form are similar to the adult life stage of the same species, unlike the larval stage of insects that go through complete metamorphosis (holometabolism) which have distinctly different morphology from the adult stage.
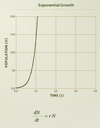
Exponential growth
Exponential population growth occurs when there is optimal environmental conditions and overlapping generations/multiple reproduction events. Exponential growth occurs typically only for short periods of time during which necessary resources remain abunant (e.g. introduced new species, many deaths=abundant resources, good environmental conditions). Examples of exponentially growing species include pests, exotics, pioneers, and humans.
The increase in a population’s size is proportional to its current size:
Nt = N0 ert
r is the per capita growth rate. The relationship between r and λ, the finite rate of increase, is:
r = lnλ
The instantaneous rate of change for the population, dN / dt is:
dN/dt = rN
What is the relationship between r and λ?
r = ln(λ)
r for a growing population?
r > 0
r for a shrinking population?
r < 0
r for a population with no growth?
r = 0
Compare r and λ
Intrinsic Growth Rate
The intrinsic population growth rate (or intrinsic rate of increase), symbolized by rmax, is the population growth rate, per individual, for a population with unlimited resources. It is the theoretical maximum value of the per capita growth rate, r.
The per capita growth rate (r) will approach the maximum intrinsic growth rate (rmax) when the environment is completely ideal for the species.
Doubling time
The doubling time of a population td is a constant value for any population growing exponentially.
td = ln(2) / r
td = 0.693 / r
Demographic Transition
Demographic transition is a model that describes changes in human populations over time. As nations develop, industrialize, and become more urban, their populations switch, via stages, from having high birth/death rates to low birth/death rates.
Replacement Level
The replacement level of a population is the rate of reproduction that offsets mortality and maintains a stable population size. In human demography, the replacement level for a couple is considered to be around 2, since two children per couple replaces their two parents in the population after the parents die. If the birth rate of a population is below the replacement level, that population will decline in size through time.
Carrying Capacity
Maximum number of individuals that an environment can sustainably support (K)
Logistic Growth
Logistic growth is a model of population growth in which the per capita growth rate ( r ) declines as the population size increases. As a population approaches its maximum possible size (its carrying capacity, K ), the growth of the population slows towards no growth. A plot of population size versus time for logistic growth produces a sigmoid, or S-shaped, curve.
What causes variability in carrying capacity?
Weather conditions, disease, predation, and chance events
Graph of Logistic Growth
Graph of Exponential Growth
What are the types of factors that can limit population size?
Density dependent and density independent
Density dependent factors
Factors that have an impact that changes depending on population size/population density (e.gg food, light, space, disease, predation, parasitism)
Density independent factors
Factors that have the same size effect on small and large populations (e.g. thunderstorm, hurricanes, pollution, floods, fires)
Population distribution
Physical location of where organisms of a population inhabit
Abundance
Number and density of organisms in an area (relative representation of a species)
Almost every environment on earth has life, yet no organism is able to tolerate every environment – Why?
Extremes are too great, and at some point energy for survival > energy gained by organism
What are the limiting influences on population distribution?
- Direct physical environment (niche)
- Indirect physical environment (act on associated species, prey, etc)
- Local/microclimate
- Competitive interaction
Niche
All the factors necessary for existence (when, where, how)
Fundamental niche
Entire breadth of physical conditions where a species can potentially live
What are the distribution patterns within a population?
- Small scale–small distances over which there is little environmental change relative to the organism
- Large scale–areas over which there is considerable environmental change relative to the organism
Small scale distribution
Small distances over which there is little environmental change significant to the organism
Large scale distribution
Areas over which there is considerable environmental change significant to the organism
Bigger organisms have _______ population densities.
Lower
What determines species rarity?
- Geographic range (restricted)
- Habitat tolerance (narrow)
- Local population size (few)
What are the types of small-scale population distribution? What causes these patterns?
- Random – neutral interactions
- Regular – antagonistic interactions
- Clumped – positive/attractive interactions
How can you assess small-scale distribution?
- Count # individuals in each plot in sample site
- For each plot, calculate the mean #individuals of a species and determine the variance (s2) around the mean
- Draw conclusions on distribution pattern
- variance < mean —-> regular distribution
- variance > mean —-> clumped distribution
- variance = mean —-> random distribution
From a large-scale perspective, population distribution is always _______. Why?
Clumped. Individuals conecntrate around environmentally suitable, resource-rich areas.
Population density decreases as the size of the organism _____.
Increases
What is the use of the generalization of the population density and organism size relationship?
Since in general population density increases as organism size decreases, and the relationship is ~linear, this generalization can be used to estimate the estimated population density of an unknown species of known size/taxonomic group.
Population
A group of individuals of a single species inhabiting a specific area
Population dynamics
The continuous flux in population abundance and distribution over time
What are the measures involved in population dynamics?
r = birth - death + immigration - emigration
Population dispersal
Movement of organisms
- Range expansion
- Dispersal within population range
- Dispersal between metapopulations
Range expansion
Movement of individuals to establish populations in new areas, typically on the margins of their existing range
Dispersal within population range
Individuals move within the boundaries of their established population range
Dispersal between metapopulations.
Population distribution can lead to the creation of subpopulations that are typically large and self-sustaining. However, if there is gene flow among these subpopulations (e.g. via migration), then a metapopulation can be established.
Individuals typically disperse to subpopulations ____ than the one they were from.
Larger
Source-sink relationship
When a source subpopulation (increasing size, exporter of individuals) exports individuals to sink populations in less-suitable habitat.
Source subpopulation
a subpopulation that is often increasing in size and exportsindividuals to surrounding subpopulations
Sink Subpopulation
often less suitable habitat with a non-self-sustaining populace. These sinks may go extinct without being rescuedfrom source populations.
_____ are a buffer from catastrophic events and can rescue a species from extinction.
Sinks