Parametric Statistics - Dr. Wofford Flashcards
Mean
•Mean: average
- •Sum of a set of scores/number of scores
- •µ= average of a population; x-bar= average of a sample
- •Best measure to use with ratio or interval data
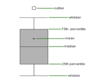
Types of Data
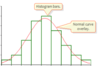
- •Normally distributed data
- •Bell shaped curve
- •Parametric Statistics
- •Nonnormally distributed data
- •Skewed curve
- •Skewed to the left
- •Skewed to the right
- •Nonparametric statistics
- •Skewed curve
3 Post - hoc testing options
- •Different options
- •Tukey (SPSS does for you)
- •Scheffe (SPSS does for you)
- •Most flexible method
- •Bonferroni t-test (by hand, bu tPSS might be able to run for you)
- •Alpha level/# of tests
Three things about ANOVA (suff besides assumptions):
- •ANOVA determines whether the means of >2 samples are different
- •Was developed to prevent Type 1 error from using multiple t-tests
- •ANOVA partitions total variance within a sample (sst) into two sources: a treatment effect (between the groups) and unexplained sources of variation, or error variation, among the subjects (within the groups)
Variability means
The dispersion of scores
Homogeneity of variance
•Homogeneity of variance: relatively similar degrees of variance between groups
- •Levene’s test for homogeneity of variance
- •Want the p value to be >.05
Sum of Squares is squared because:
to get rid of the negative values
Nonnormally distributed data
- Skewed curve
- skewed to the left
- skewed to the right
- Nonprarametric statistics
Prediction
- •Prediction
- •Simple and multiple linear regression
- •Logistic regression
A category of parametrict test
T-Stat for T-Test
- •T-stat= difference in means between groups/variance between groups.
- T-stat = (x-bar2 - x-bar1)/s2
- •Increased t-stat values=increased probability of having a significant result
- •Greater mean difference with less variance equates to a higher t-stat
- •Compare the t-stat to a critical value (located in the appendix) to determine whether it is significant at the predetermined alpha level
- (will produce p-number that can show if results are statistically significant or not)
•Post hoc testing – what is it for, what else is it called?
- Post hoc testing – use to find where the difference lies after you establish there is a significant difference somewhere with ANOVA
- Also called unplanned comparisons
If T-stat is high, _________ is low (or should be?).
p-value
p-value standard should be alpha (0.05 is the usual standard)
ANOVA and t-test are really about the same thing?
yes
T-Test: Test statistic
•Test statistic: t-stat
•ANCOVA:
1 DV, 1 IV, 1+ covariates
- •Covariates must not be correlated
In parametric statistics Every test has _________ and researcher must _______________.
assumptions
meet assuptions of the test
Mean Square
•Mean square (ms): ss/n-1= sample variance
- •Combats the problem of sample size with sum of squares
- •Is called variance and is a true measure of variability
- •Sample variance is annotated as s2
Meaning of ANOVA Assumption:
•Scores are independent- not correlated
They are not too related. its hard to explain without going into too much. You will meet that.
If you have two scores that are similar. It could be that they are correlated, but that hardly ever happens.
We don’t have to worry about this right now.
Three Parametric Statisics terms
- Difference in Groups
- Association/Strength of Relationship
- Prediction
What is the problem with running multiple t-tests
if you run several t-tests, you increase the liklihood of getting a significan result, so you can get a type I error.
So ANOVA was created
•Kolmogorov Smirnov test
a stats test of normality
Range
•Range: Difference between highest and lowest values in a distribution
- •Limited utility when describing variance
T-Test Assumptions
- •Data is measured at least at the interval level
- •Scores are independent- not correlated
- •Normality
- •Homogeneity of variance
- •Independent t-test
analagous homogenity of variance for Repeated measures testing is _______________
•Sphericity: similar to homogeneity of variance for repeated measures
- •Test using Mauchly’s test- want a nonsignificant result
- •Available corrections:
- •Huynh and Feldt, Greenhouse- Geisser
What do you compare T-stat to?
The critical value (in a glossary in your book, that will tell us if it is statistically significant)
Draw a Box Plot

Mean, median, and mode are the same number when
data is normally distributed
Draw the parametric/non-parametric test chart

Levene’s test
a stats test for homogenity of variance
Want the p-value to be > 0.05
Draw a Scatterplot

Two stats tests to assess normallity
- •Kolmogorov Smirnov test
- •Shapiro Wilk test
Mode
•Mode: score that occurs most frequently in a distribution
- •Most easily seen using a frequency distribution/graph
- •Useful with nominal and ordinal data
Three groups that Parametric Testing can be split into
- •Difference in Groups
- •Univariate: 1 DV
- •Multivariate
- •Association/Strength of Relationship
- •Prediction
Normally Distributed Data
- Bell shaped durve
- Parametric Statistics
Can correct for finding significant difference when checking Sphericity with the following 2 methods (don’t have to know what they are):
- Huynh and Feldt,
- Greenhouse- Geisser
T/F: a T-test can be used for more than two samples.
False!
You can use it for 2 things:
same people before and aftor
or two different people one time
What else is needed with ANOVA to find which variables are have significant variables?
Post hoc testing
Because ANOVA just tells you there are easter eggs out there (there are significant relationships), but not where they are (what relationships are significant)
Do you want T-stat to be high or low?
Higher the better
If we have a high f-stat, what will p-value do?
it will be low
•Repeated Measures (ANOVA type)
- •Sphericity: similar to homogeneity of variance for repeated measures
- •Test using Mauchly’s test- want a nonsignificant result
- •Available corrections:
- •Huynh and Feldt, Greenhouse- Geisser
- •Test using Mauchly’s test- want a nonsignificant result
ANOVA: everything
- ANOVA determines whether the means of >2 samples are different
- Was developed to prevent Type 1 error from using multiple t-tests
- ANOVA partitions total variance within a sample (sst) into two sources: a treatment effect (between the groups) and unexplained sources of variation, or error variation, among the subjects (within the groups)
- Assumptions:
- Data is measured at least at the interval level
- Scores are independent- not correlated
- Normality
- Homogeneity of variance- only really a problem with unequal sample sizes
- Independent t-test
Draw a Histogram

Do we want sphericity to be significant or non-significant?
we want it to be non-significant (because we want individuals in a group to be similar)
Just like levines.
Can correct for significance with the following methods (don’t have to know what they are):
- •Huynh and Feldt, Greenhouse- Geisser
scatter plots are used in ______ analyses.
regression
T-Tests: everything
- •T-test: test whether the means of two samples are different
- •Assumptions:
- •Data is measured at least at the interval level
- •Scores are independent- not correlated
- •Normality
- •Homogeneity of variance
- •Independent t-test
- •Two types:
- •Independent (unpaired): comparison of two independent, different samples (Like two subjects)
- •Dependent (paired): comparison of same sample on two different occasions, (like same people before and after treatment)
- •Test statistic: t-stat
Sum of Squares
•Sum of squares (ss): sum of (X-Xbar)2
- •As variability increases, the sum of squares will be larger
- •Influenced by sample size- as sample size increases, the sum of squares will increase because there are more scores
Histogram can be used to assess what?
Visually asses normal distribution (or not) of data
Should also back this test up with a stats test to confirm/deny normality
ANOVA stands for
Analysis of variance
what three things do we need to understand in order to understand a t-test and an ANOVA?
- Sum of squares
- Mean square
- Standard Deviation
What is another name for box plot?
Whisker plot
•Shapiro Wilk test
a stats test of normality
why did they do the standard deviation?
So we would have a standard units of measure
Same units of measure as used in original measurements
so if you measured ROM in degrees, the SD will be in degrees too?
Four ANOVA assumptions:
Assumptions:
- Data is measured at least at the interval level
- Scores are independent- not correlated
- Normality
- Homogeneity of variance- only really a problem with unequal size
- Independent t-test
Difference in Groups (2)
- •Difference in Groups
- •Univariate: 1 DV
- •T-test
- •Analysis of variance (ANOVA)
- •Multivariate
quick way to tell your data is normally distributed
mean, median, and mode are the same value
To use Parametric Statistics you need what kind of data?
normally distributed data
Percentiles:
•Percentiles: Description of a score’s position within a distribution
- •Helpful in converting actual scores into comparative scores or for a point of reference
Three Measures of Central Tendency
- Mode: Score that occurs most frequently in a distribution
- Median: rank-ordered distribution split into two equal halves
- Mean: average
Variability: Measures of Range
- Range
- Percentiles
- Quartiles
Three Statistical Graphs
- Histogram
- Scatterplot
- Box plot
One-way ANOVA:
1 DV, 1 IV
Normality
•Normality is an assumption of every parametric test
- •Ways to assess normality:
- •Histogram
- •Kolmogorov Smirnov test
- •Shapiro Wilk test
Two assumptions that are neccessary for parametric statistics
- Normalitiy is an asmpption of eery parametric test (normal distribution)
- Homogenity of variance: relatively similar degress of variance betwen groups
What can you do instead of T-tests if you want to compare more than 2 groups?
ANOVA!
(if you run several t-tests, you increase the liklihood of getting a significan result, so you can get a type I error)
ANOVA produces an __________, whereas a t-test produces a ___________.
F-stat
t-stat
(they produced almost the same way)
Association/strength of relationship
•Association/Strength of Relationship
- •Linear= pearson’s r
A group for parametric testing
Two types of T-tests
- •Independent (unpaired): comparison of two independent, different samples
- •Dependent (paired): comparison of same sample on two different occasions
•Quartiles
•Quartiles: Divides a distribution into four equal parts or quarters
- •Q1-Q3 (25%-75%)
- •Q2 is the median (50%)
- •Interquartile range: Q3-Q1- represents boundaries of the middle 50% of the distribution
- •Visually depicted using a box plot
Mode is most useful with which kind of data?
Nominal and ordinal data
Median
•Median: rank-ordered distribution split into two equal halves
- •Useful for ordinal data
Factorial ANOVA:
1+ IV, 1 DV
Why did mean square come about?
It came about from the probelm of sample size effecting sum of squares
It basically makes it an average value
This is called true variance!!
Types of ANOVA
•Types of ANOVA:
- •One-way ANOVA: 1 DV, 1 IV
- •ANCOVA: 1 DV, 1 IV, 1+ covariates
- •Covariates must not be correlated
- •Factorial ANOVA: 1+ IV, 1 DV
- •Repeated Measures
- •Sphericity: similar to homogeneity of variance for repeated measures
- •Test using Mauchly’s test- want a nonsignificant result
- •Available corrections:
- •Huynh and Feldt, Greenhouse- Geisser
- •Test using Mauchly’s test- want a nonsignificant result
- •Sphericity: similar to homogeneity of variance for repeated measures
Standard Deviation
Standard deviation: square root of s2
- •ss in original units of measurement is the standard deviation
A measure of Variability
•Test statistic: F-stat
Used for ANOVA. Basically calculated the same as t-stat (even though there are some differences below)
Test statistic: F-stat
- •F= MSb/MSe
- •mean square= ss/df
- •Calculate mean square values for both between groups (MSb) and error sum of squares (Mse)
- •Greater between group difference with less variance= larger f-stat
- •Compare f-stat to critical value (in appendix) to determine whether the value is significant at the predetermined alpha level
Variability
•Variability: dispersion of scores
- •Measures of range
- •Measures of variance