New Exam - PCA / FA Flashcards
What is the difference between PCA and FA?
FA = Explaining relationships between observed variables with a smaller number of factors. Latent factors that theoretically underpin data. Exploring.
PCA = Not theoretically driven – Just reducing data down to a smaller number of components. Don’t care about latent factors. Does not assume there is something latent out there driving the relationship. Just want to reduce down to simpler lower dimensional set of scores. E>G –> too many variables to satisfy assumptions of a regression (too many predictors / or highly correlated) …. So, use PCA to reduce them down to a set of unrelated components. Some people label them, but need to remember …. Not latent factors!
FA Assumed factor causes variation in the observed items
PCA Not causal, goes other way round. PCA component is driven by the items. The component is a representation of the items. It is an aggregate of the items. Not caused by them. Aggregated weighted fashion.
FA is for theoretical basis
PCA is for reducing and extracting linear composites from data for further analysis
FA measures the SHARED Variance – minimal error and unique variance
PCA – tries to account for ALL the variance (1’s in diagonal)
Explain this output
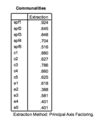
Should explain the meaning of the extracted communalities - i.e. extracted communalities (or h2) represent the proportion of each variable’s variance that can be explained by the retained factors. In this instance communality values are high suggesting a good solution with three factors retainedShould explain the meaning of the extracted communalities - i.e. extracted communalities (or h2) represent the proportion of each variable’s variance that can be explained by the retained factors. In this instance communality values are high suggesting a good solution with three factors retained
Key part of this output?
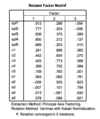
- Orthogonal Rotation. Should explain that the chosen orthogonal rotation produces uncorrelated factors (comparison with oblique may aid explanation). Should note that the researchers’ decision to use orthogonal rotation may have been based on the assumption of independent underlying ‘embarrassability’ processes(they were thought of as 3 separate things with no shared variance)
- Factor Loadings. Should explain meaning of factor loadings. Should note that pattern of factor loadings is generally highly consistent with research expectations.
- Factor Loadings 2. An especially good answer may note that there are a number of complex variable loadings across factors ‘1’ & ‘2’. This suggests that, although factors 1 & 2 are delineated by high factor loadings and theoretical coherence, there appears to be a notable degree of common association. As such, repetition of FA with an oblique rotation might be more appropriate or perhaps confirmatory FA (SPF & C may share a common process that should be examined).
What are the key things to mention from this output?
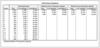
- Factors retained. Should comment on the decision to retain 3 factors. Given the expected three factors, hypothesis testing could be justified, Catell’s Scree, Kaiser’s Eigenvalue, interpretability (the no. of factor that produce a ‘meaningful’ solution) or other methods could have been used. Hypothesis testing + at least 1 other should be mentioned. The consistency across these methods, with all seeming to suggest 3 factors, is also worth noting (although scree not shown, eigenvalues are listed).
- Variance explained. Amount of variance explained by the retained factors should be noted - in this case the explained variance is a fairly high 64% suggesting a strong solution with just 3 factors (despite 15 variables). This implies that 3 underlying processes may largely drive peoples ratings of embarrassment in the situations listed.
In line with the theory (3 were posited)
What is a method for assessing multicollinearity in FA or PCA?
Running multiple regressions regression on each variable with all the other variables as predictors
They would be looking for high values of R2 (approx >.90) or more as indicating multicollinearity, as this would indicate a (too) high degree of overlap between the variables, and thus possible multicollinearity. This method is of course legitimate as the values of R2 are the SMCs usually reported in the initial communalities table (absent in the current SPSS output). Low values of R2 for a variable as the DV would also indicate it was relatively unrelated to other variables in the set.
What does this show?
And also what does it not show that you should comment upon?
FACTORISABILITY
Correlations need to be >.30 in matrix
- Test it using Bartlett’s test of sphericity – not that helpful – sensitive to sample size – identifies sig large correlations,,,, but yeah not great.
- Anti-image correlation matrix – This is the matrix of partial correlations between each pair of variables, partialling out each of the other variables (and multiplying resulting partial correlations by -1). The partial correlation between variables A and B should be small if another variable or variables in the matrix indexes the same factor as is responsible for covariance between A and B. Thus the presence of small values on the off-diagonal in this matrix is another indicator of factorisability
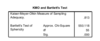
- KMO – Kaiser-Meyer-Olkin – Aggregate measure for the whole corr matrix, expressing size of Anti Image Correlations, scaling it all between 0-1, and should be above >0.6.// .8-.9 good.
So KMO and Bartlett’s correctly regarding factorisability of the correlation matrix. Indicates that it is factorisable KMO>0.6.
Comment on other aspects of the study which may be taken into consideration to determine whether the data obtained are likely to be suitable for factor analysis
- Up to 4 marks for comments on other aspects of the study, including : N (=98), marginal for FA, acceptable for some authorities but not others; ratio between N and number of variables (98:11), roughly nine observations per variable (acceptable according to most authorities); number of factors (expected=3), and with at least 3 variables expected to load on each individual factor, also marginal but acceptable; nature of the data (ie subscale scale scores) Ok for FA.
What might a researcher glean from this scree plot?
What is the turning point called?
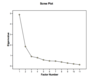
- Scree plot pretty clearly indicates 2 factors in the data, as the eigenvalues for factors 3 and beyond are all pretty similar. Give 2.5 marks for getting the number correct and 2.5 marks for the justification. If someone says that only 2 eigenvalues are greater than 1 then do not give marks for the justification part (as I told them that this is now not accepted as a decent criterion).
Point of inflexion
Which type of rotation are all of these:
varimax promax quartimax, oblimin , equimax
orthogonal (varimax, quartimax, & equimax),
two are oblique (direct oblimin & promax). F
What is Varimax rotation?
Varimax rotation is a form of orthogonal rotation of the solution (ie all factors are uncorrelated) which is designed to maximizes the variance of the factor loadings over the variables (hence the name). This simplifies the factors by having either high or loading variables and avoiding variables with mid-loadings. This makes factor interpretation/labelling easier (hence popularity of method).
Define KMO and Bartletts
KMO measure of sampling adequacy (MSA) and Bartlett’s test of sphericity are means for establishing the factorisability (or factorability) of a correlation matrix. In other words for checking whether there are meaning ful relationships between subsets of the variables which can cluster into factors/components. KMO has to be >0.6 to indicate factorisability. Bartlett’s test being significant means that the hypothesis that there are no factors can be rejected but this test is overly sensitive.
what are communalities?
Communalities represent the amount of overlap in the variables using squared multiple correlations (ie each variable with all other variables as predictors), if >.90 problematic. like a multiple regression
What are the rules of thumb for sample size?
1)
Comrey and Lee (1992) suggest:
50= v poor
100=poor
200=fair
300=good
500 v good
>1000 excellent.
Smaller N ok if higher loading markers on factors.
2)
Variables to Factors should be mentioned
(as above e.g. Tabachnik & Fidell 5 or 6:1;
Klein 3:1; Thurstone 3:1; Kim & Mueller 2:1)
3)
SOME say ratio of participant to variable –
Nunnally 10:1,
Guildford 2:1,
Barrett & Kline find 2:1 replicates structure while 3:1 is better)
Model specification. Good responses will note that factors are based only on ……………
items included in the questionnaire; there may be more
Explain what these offer in detail
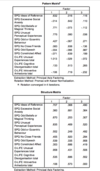
the pattern matrix is a matrix of regression-like weights used to estimate the unique contribution of each factor to variance in the variable; the structure matrix is the matrix of correlations between variables and the correlated factors. Although the structure matrix is easily understood the pattern matrix is usually easier to understand because it represents the unique contribution of each factor to variance in the variables and so shared variance is omitted. In the structure matrix the correlation between variable A and factor 2 can be inflated by the fact that factors 1 and 2 are correlated, and by the fact that variable A loads on factor 1. This alone will make it appear as if variable A loads onto factor 2. Thus, the set of variables that compose a factor is usually easier to see in the pattern matrix. (although if factors are very highly correlated then no variables may appear to be related to them!) Might comment on the fact that one of the loadings in the pattern matrix is actually greater than 1 (this is a Heywood case and indicates that something may be wrong with the solution; here possibly that 2 many factors have been extracted!)
- What does this factor loading plot reveal to the researcher? (5 marks)
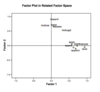
The factor loading plot indicates that at least one of the variable (olicogdt) does not load cleanly onto one factor or the other; it violates simple structure and loads onto both factors. Same may also be true for oliintat to a lesser degree.
if a factor is a clear outlier ….
rerun the analysis dropping the awkward (outlier) variable (olicogdt) as a single variable is not enough to define an additional third factor and a more stable factor solution (with 2 factors) would be obtained if the non-simple variable were excluded.
spss takes a standard approach to extract any factor over X
eigen value of 1
Which one should be used with which rotation method?

Varimax rotation = Rotated component matrix
Direct Oblimin = Pattern Matrix
Factor Loading should be around which value to be interpretable?
0.32
How do we assess Multicollinearity in FA or PCA?
Which output for PCA?
Which output for FA?
IN PCA: Collinearity can be assessed by examining correlation matrix (.90 bivariate a problem). SMC values from an initial communalities table (not present in output) ≈>.90 suggests MC with low SMCs (≈<.10) indicating item redundancy.
IN FA: check the communalities: Check the initial columns… if value is near 0, it means it is explained by other variables and doesn’t add anything…

what other cleaning issues can be problematic ?
missing values
Should mention whether to use listwise, pairwise (to be avoided) or imputation. Always listwise if numbers allow. Good answer could discuss different forms of imputation (regression, mean etc)
Data screening
should be carried out to check for data normality (frequencies, graphs etc.) with no univariate, bivariate or multivariate outliers (e.g. frequencies, scatter plots etc.). Normality not critical but non-normality can diminish correlations thus less clear solutions. Should also check for illegal data values (i.e. <1 or >9).
what going on here?


So, in FA and PA, items are influenced by variation in various things across people. Three things to be exact. What is it that is causing people to vary?
1) Shared variance between items
So the factor (latent variable) is causing variance in certain items - items vary together because of the latent factor - all the same variance associated with one factor
2) Unique Variance for one item
(might be one item or interactions with other items - independent of the latent variable - but always same, stable variance over time – meaningful – independent of other items)
3) Error variance
(random in ideal case, you will vary in your score across times of measurements) LEAST INTERESTING – random and not stable over time
SO WHICH TYPES OF VARIANCE DO THE TWO TYPES USE?
FA
Shared variance - variance caused by the factors causing numerous items to vary
PCA
ALL - including the error and unique
This causes a technical difference with the way you set it up.
In FA, you start process (iterative) by saying, each factor you use xxx xxxx to estimate the shared variance of the items of that factor. FA replaces 1’s (corr with itself) with estimate of shared variance on a particular factor with that item, using xxxx, start process and it iteratively improves the solution.
PCA use the corr matrix as it is. You can tell from the initial communalities output which is being used - and you can see what?.
multiple regression
Regression
1’s
FA is for xxxxxx xxxxx
PCA is for ……
FA is for theoretical basis
PCA is for reducing and extracting linear composites from data for further analysis
?

FA Assumed factor causes variation in the observed items
PCA Not causal, goes other way round. PCA component is driven by the items. The component is a representation of the items. It is an aggregate of the items. Not caused by them. Aggregated weighted fashion.
which assumption is not critical?
normality
works better - but not crucial
unless you are using some test we didnt cover
which assumption is super bad news?
outliers
4 ways of checking FACTORISABILITY?
oh and define it too
1)
Check correlation matrix of variables, look for variables with > .30 relationships. Also examine matrices of partial correlations if necessary.
2)
Bartlett’s test of sphericity – test of identity matrix. Very sensitive to sample size i.e. large N likely to produce a significant result.
3)
Anti-image correlation matrix – contains the negatives of partial correlations between pairs of variables with effects of other variables removed. Look for small values on off- diagonal elements.
4)
Kaiser-Meyer-Olkin measure of sampling adequacy – values > .6 required, .8-.9 considered good.
?????

PCA
all 1’s
Extracted communalities represent
the amount of variance in each variable explained by the factors (i.e. variables as DVs, factors as predictors).
what is an eigenvalue?
Eigenvalue is the amount of variance explained by each factor.
what is the factor extraction method given by how2stats?
Parallel analysis
Eigenvalue Monte Carlo Simulation to test significance of factors or components worth extracting
Essentially a randomisation / permutation test in SPSS syntax comparing your values against a randomly generated
What is the aim of rotation?
Doesn’t change the maths
The aim of rotation is to clarify the relationships between clusters of variables by rotating the axes of the factors
same quality solution - just simplifies it
two types of rotation?
oblique
orthogonal
Which is more readily used?
What is rule of thumb for interpretation?

Rotated factor loadings are usually easier to interpret (but not always, so check unrotated solution as well).
Rule of thumb is > .32 i.e. factor explains approx 10% of variance in the variable.
When an orthogonal rotation is used, a xxxx xxxxx matrix is produced – use this for interpretation.
• With oblique rotation, there are 3 tables
factor loading matrix
– structure matrix - as above
– pattern matrix – factor loadings but after partialling out overlap with other factors. Best for interpretation.
– factor correlation matrix – degree of relationship between factors.
what is the reason for reading the correct matrix?
for factor naming purposes ….
which you will have to do in exam… i.e. check the variables loading on factor, and name it.
to get variance accounted for by factors using matrix?
– Sum down each column of the squared matrix for eigenvalues.
– Divide by the number of variables for variance accounted for by each factor.
– Sum these values for variance accounted for by the model.
