Multiple Regression Flashcards
Multiple regression allows
Hypotheses of no explanation of the dependent variable to be tested, and the nature of variable interactions to be explored by objective methods.
Multiple regression attempts to
Predict the variation in a single dependent variable (Y) on the basis of two or more predictor terms.
Multiple regression equation
Y = a+b1X1+b2X2+….bnXn+-e
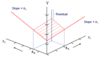
Scatter of points represented in graphical form
This cannot be done in the multivariate case in which each variable requires an axis for its representation. The principle of adopting the least-squares criterion remains important, and is adopted to define the best-fit surfaces through n-dimensional space. This concept can be illustrated by the case of two predictors and one dependent variable.
Problem in multiple regression
We shouldn’t be tempted into assessing the importance of the each predictor by reference to its partial regression coefficient, and large values do not imply greater importance. Such comparisons are best made through the medium of beta weights.
When our initial interest lies with the explanatory capability of the model as a whole this can be found from
The Multiple coefficient of explanation (R2), which is linked to the multiple correlation coefficient. The latter is a direct counterpart to the simple correlation coefficient but measures the association between the dependent variable and, in effect, a group of two or more predictor variables.
Partial correlation coefficients measure
The correlation between the dependent variable and each of the individual predictors, but, again, holding constant all other predictors in the model.
Partial correlations are useful when we want to
Examine the intrinsic association between two variables in complex multivariate situations.
Number of ‘controlled’ variables determines
The order of correlation. Simple correlations are zero-order. First-order partial correlations have only one controlled variable, but can be derived from the various zero-order correlations between each of the variables in the data set.
Multicollinearity
Refers to the situation where correlation exists between several predictor variables. When two predictors are strongly correlated their respective zero-order correlations with dependent variable may often suggest similarly strong degrees of association to exist.
Difficulty of multicollinearity comes from
The fact that in multiple regression we might be tempted to employ two such variables, both of which appear to have a strong correlation with the dependent item, only to find that one of them emerges as having a very weak partial influence, and its seemingly strong zero-order association results only from its correlation with the other.
Partial Regression Coefficients
A measure of the impact of a predictor on the dependent variable when other predictors are preesent but held constant. b1,b2…bn are scale dependent.
In common with their simple counterparts, are scale dependent, and have magnitudes that are partly determined by the units in which Xi and Y are measured.
Beta Weights
Standardise coefficients. Partial regression coefficients don’t really tell you anything about the relative importance of predictors of Y. Whereas, the beta are much more comparable.
Explained Variance
Deviation of predicted values of Y from the mean of Y.
Unexplained variance
Deviation of actual values of Y from predicted value of Y.
Assessing multicollinearity (two methods)
Tolerance scores - unique variance of each independent variable. 0.34 means 34% of the variance is not accounted for by other predictors. Tolerance of 0.20 or below is problematic.
Pairwise correlation of independent variables.
Variance inflation factor (vif score) - score of 1 = absence of multicollinearity, 3 = rejection threshold in SPSS, value greater than 5 = presence of multicollinearity, value of 10 and above = Complete multicollinearity.
Ways to address multicollinearity
Remove one or more of the correlated variables from the regression model or where there is a logical relationship between two x variables, create an interaction term, or, if variables are related due to underlying factors controlling Y, they may be reduced using factor or principal component analysis.
The F-test
Comparing regression models.
Strategies for undertaking multiple regression
Do not employ scattergun approach. Select variables based on theory and previous findings. Careful analysis of the charcater of relationships. Don’t rely on a single metric.
Parsimony
The simplest model explanation/interpretation should be sought.
Hierarchical regression
The practice of building successive models, each one adding more predictors. Researchers decide on order to list predictors. Order based on theoretical considerations.
Simultaneous regression
All independent variables are analysed simultaneously on an equal footing. An appropriate course when there is no theoretical consideration underpinning the importance of variables.
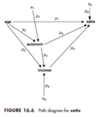
Path Analysis
Examines the relationships between 3 or more variables. Provides quantitative estimates of the causal connections between sets of variables.
Model moves from left to right - indicating causal priority to the left.
Arrows outside nexus - unexplained variances
Numbers (p) are beta values.