Lecture 2 - Analysis of Variance (ANOVA) Flashcards
(25 cards)
What is variability?
It is to do with the range/spread of data. Data can have the same mean but different variabilities, or the same variability but different averages

What do parametric tests assume?
They assume a normal population distribution
What is the normal distribution?
a mathematical function that defines the distribution of scores in a population. It does this with regard to two ‘population parameters’ - Mu/µ and Sigma/σ
Most (but not all) data is normally distributed
What does Mu/µ represent?
the population mean
is involved in calculating the normal distribution
What does Sigma/σ represent?
the population standard deviation (variance)
is involved in calculating the normal distribution
What does this show in terms of a normal distribution?
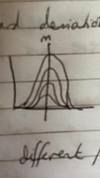
The same µ (pop mean) but different σ (std. dev./variance)
What does this show in terms of a normal distribution?
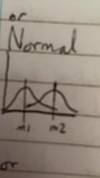
The same σ (pop std. dev /variance) but different µ (pop mean)
What does this show in terms of a normal distribution?

A different σ (pop std dev) and the same µ (pop mean)
What do variances look like when:
H0 is true
H1 is true
H0 is true - scores almost completely overlap
H1 is true - very little overlap between score distribution
What are the two kinds of experimental error?
individual differences error
measurement error
these are the two main kinds, there are others but these are the main ones. In a real experiment, both would contribute to each subjects’ score
Why do we look at experimental error?
It contributes to the differences found between treatment conditions
So we must try to find out how much of the difference can be attributed to experimental error
What can tell us about experiemental error?
The variability of subjects in the same condition ought to tell us about experimental error
What are treatment effects?
the systematic source of variability that comes from the different conditions of the IV used in each treatment grouo
What does partitinoning the deviations mean?
Basically, finding out the standard deviations
What does A1, A2, A3 etc mean?
the different treatment conditions
Why are the mean and standard deviation sometimes referred to as models?
Because they are values not actually present in the data, but they are used to describe and represent the data that is present
What does standard deviation look at?
How far away individual values are from the mean
. In this way it assesses how good the mean is as a model of the data
How do we calculate the size of a deviation? (NOT STD DEV)
How and why do we use this to calculate the sum of squares?
We subtract the mean (called x with a line on top) from the observed values.
Deviances may be positive or negative so it can give silly total deviances when some of the individual deviances are positive and some are negative.
That’s why we create a squared error (we square the deviations) - adding all of these together forms the Sum of Squares
What is variance?
How is it calculated?
Why do we use it?
Variance is the average error between the mean and the actual data value
It is the sum of squares divided by n (the number of samples)
We use it because lots of data gives us a higher sum of squares so it can be hard to compare a larger dataset with a smaller one.
How do we calculate a standard deviation?
Why do we use it instead of variance?
It is the square root of the variance
We use this frequently because it is a more meaningful way to describe the data - variance is squared and you can’t have ‘3.2 words squared’!
What is the grand mean?
the mean of several treatment conditions together
What is a sample mean?
the mean of each treatment group alone
What does the between groups deviation represent?
both error and treatment effects
What does the within-subjects deviation represent?
error alone
